1. 📌 Market Summary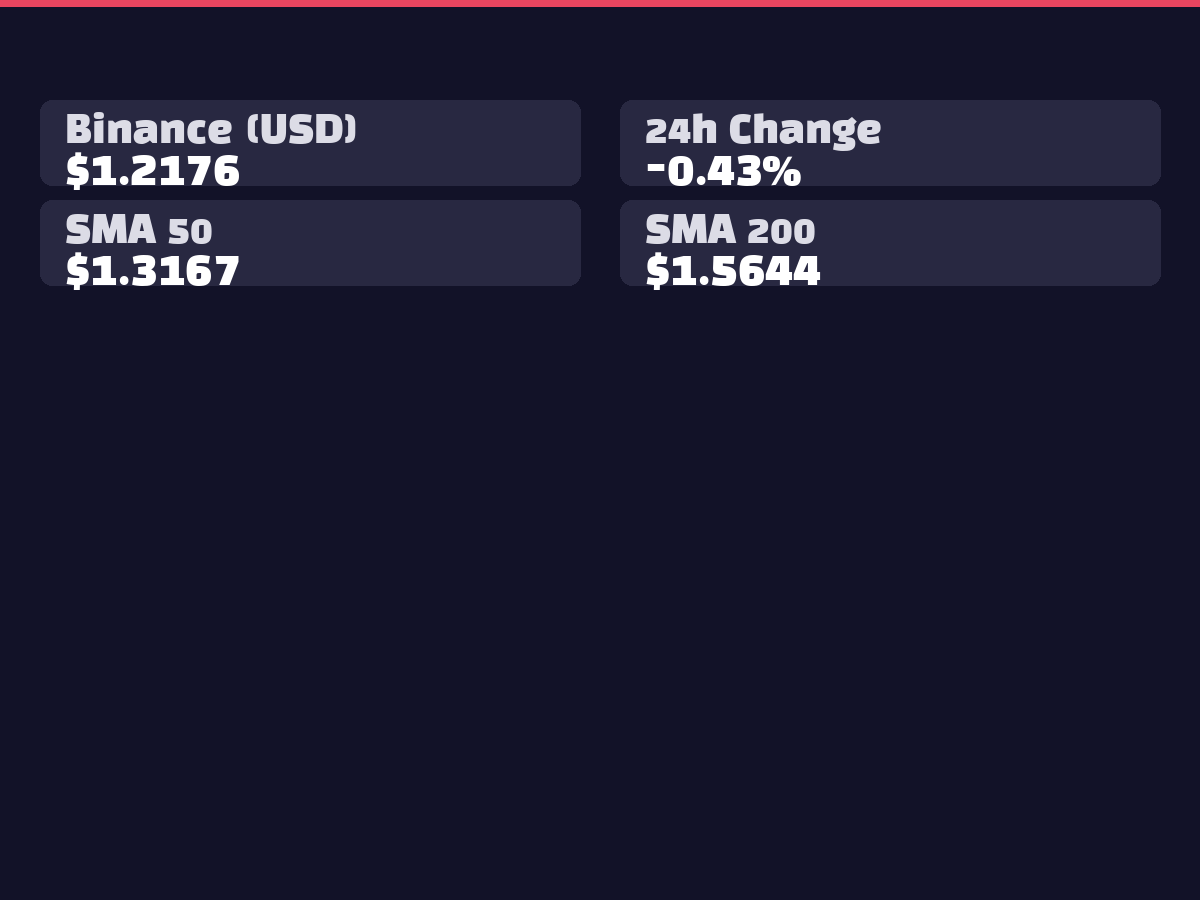
XRP is currently trading at $1.1384 on Binance, down -3.39% in the last 24 hours. On Bithumb, it's trading at ₩1,709 (-2.84%), showing overall bearish momentum. However, recent news indicates XRP is outperforming Bitcoin and Solana, with intraday gains of over 2%. Google Gemini AI's price target of $5.00-$7.00 by end-2026 is generating increased long-term interest in the asset.
2. 📊 Technical Analysis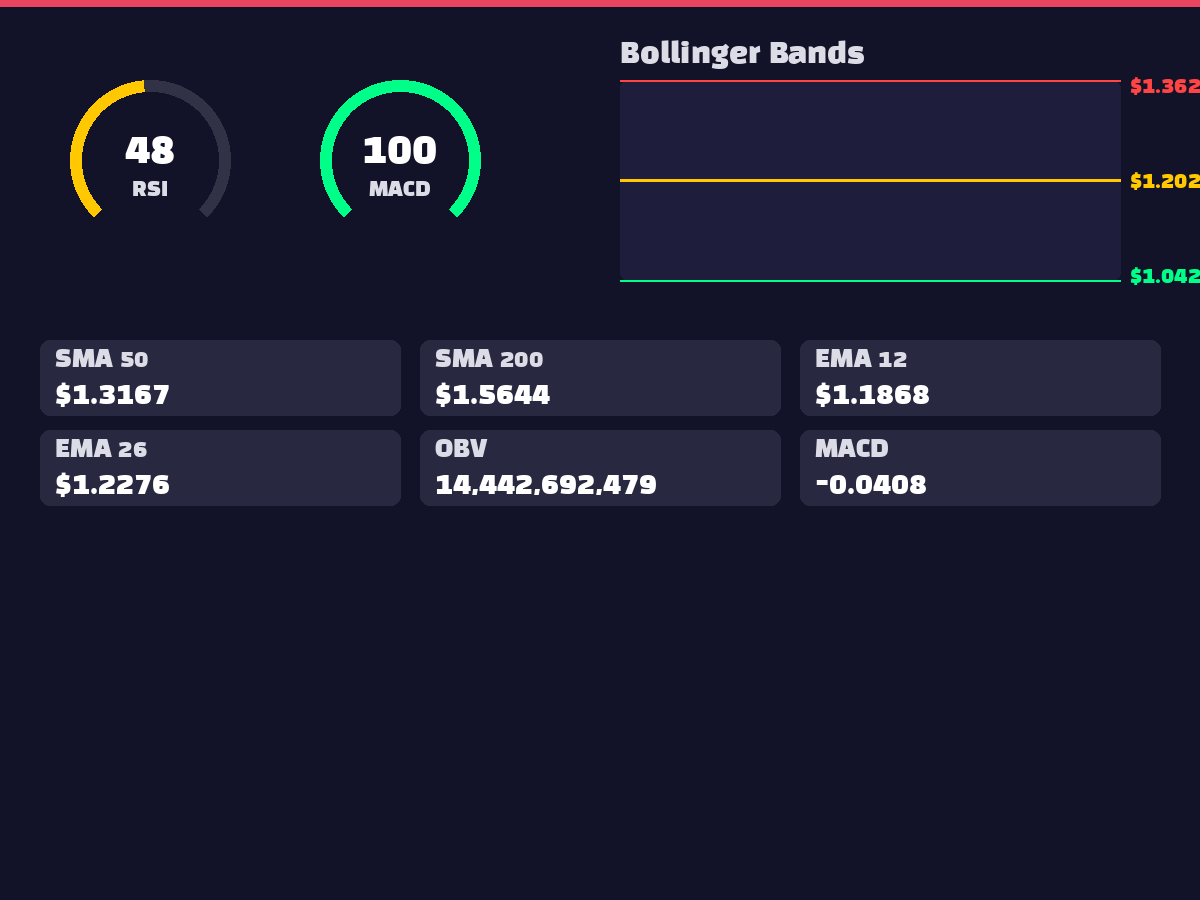
XRP exhibits strong bearish signals across key technical indicators. The RSI(14) at 34.34 approaches oversold territory, while MACD(-0.0653) remains below the signal line(-0.0499) with negative histogram(-0.0154), indicating continued downward momentum. Within the Bollinger Bands, price trades below the middle line(1.2755) and near the lower band(1.0948). Moving average analysis shows price trading below all major SMAs (20/50/200), with a significant -27.16% deviation from the 200-day SMA. OBV(14,445,495,112) suggests selling pressure amid declining volume.
3. 🌍 International Situation & Macroeconomics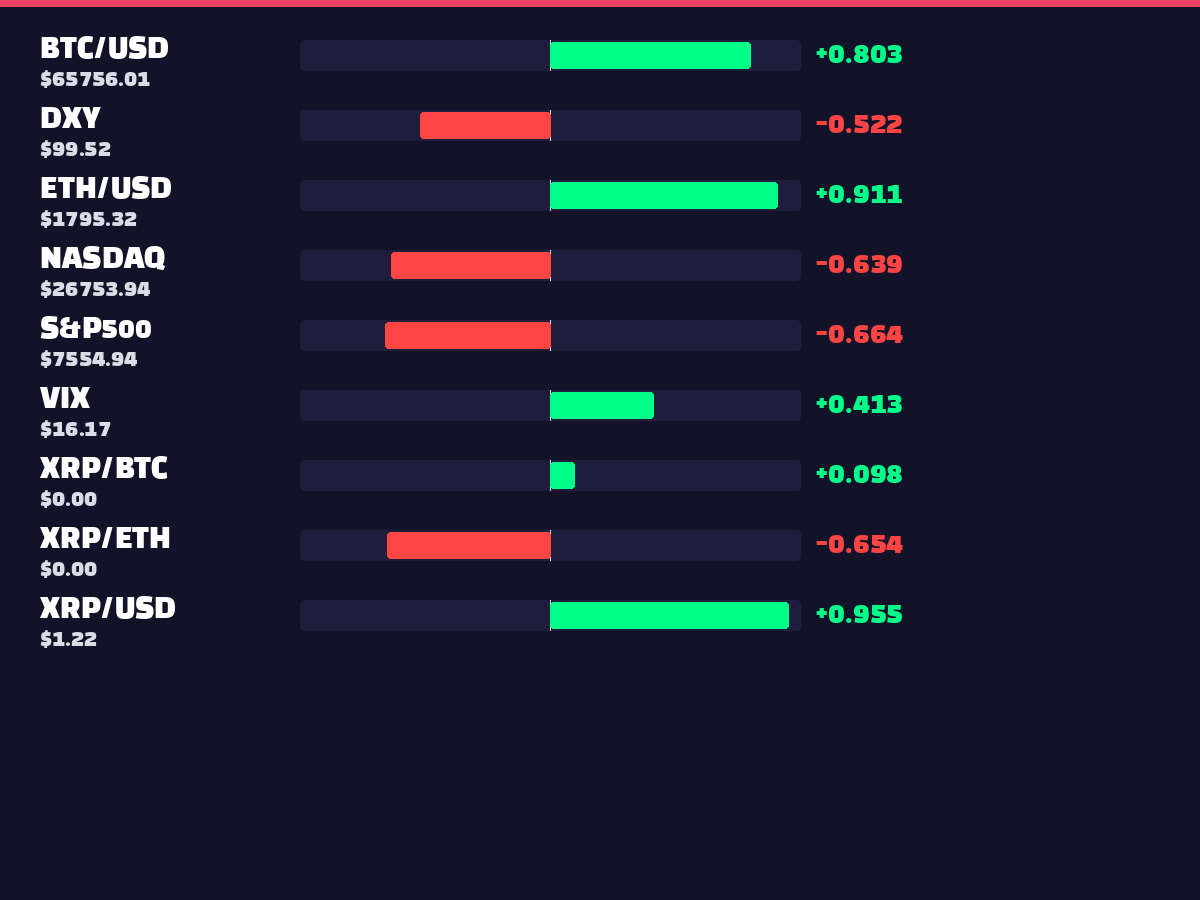
Correlation analysis reveals XRP's strong negative correlation with DXY(-0.5796) and positive correlation with VIX(0.2234). Negative correlations with S&P500(-0.5171) and NASDAQ(-0.5132) indicate contrarian movement to traditional risk assets. Escalating Middle East geopolitical tensions drove Bitcoin below $61,000, erasing approximately $30 billion in market cap across crypto markets. Arthur Hayes warned that an AI stock crash could spill into crypto markets before eventual recovery.
4. ⚖️ Regulatory & Legal Environment
Bank of America is preparing to launch cross-border real-time payment services through SWIFT or CashPro platforms, putting XRP in the spotlight. Ripple has joined DTCC's tokenization initiative alongside BlackRock and JPMorgan, with over 50 major institutions set to pilot tokenized assets from July 2026. Robinhood documentation confirms Ripple has tokenized hundreds of millions of dollars in real-world assets (RWAs) on the XRP Ledger. Senator Lummis reiterated that the US must protect Bitcoin and cryptocurrencies as pillars of financial freedom.
5. 😱 Market Sentiment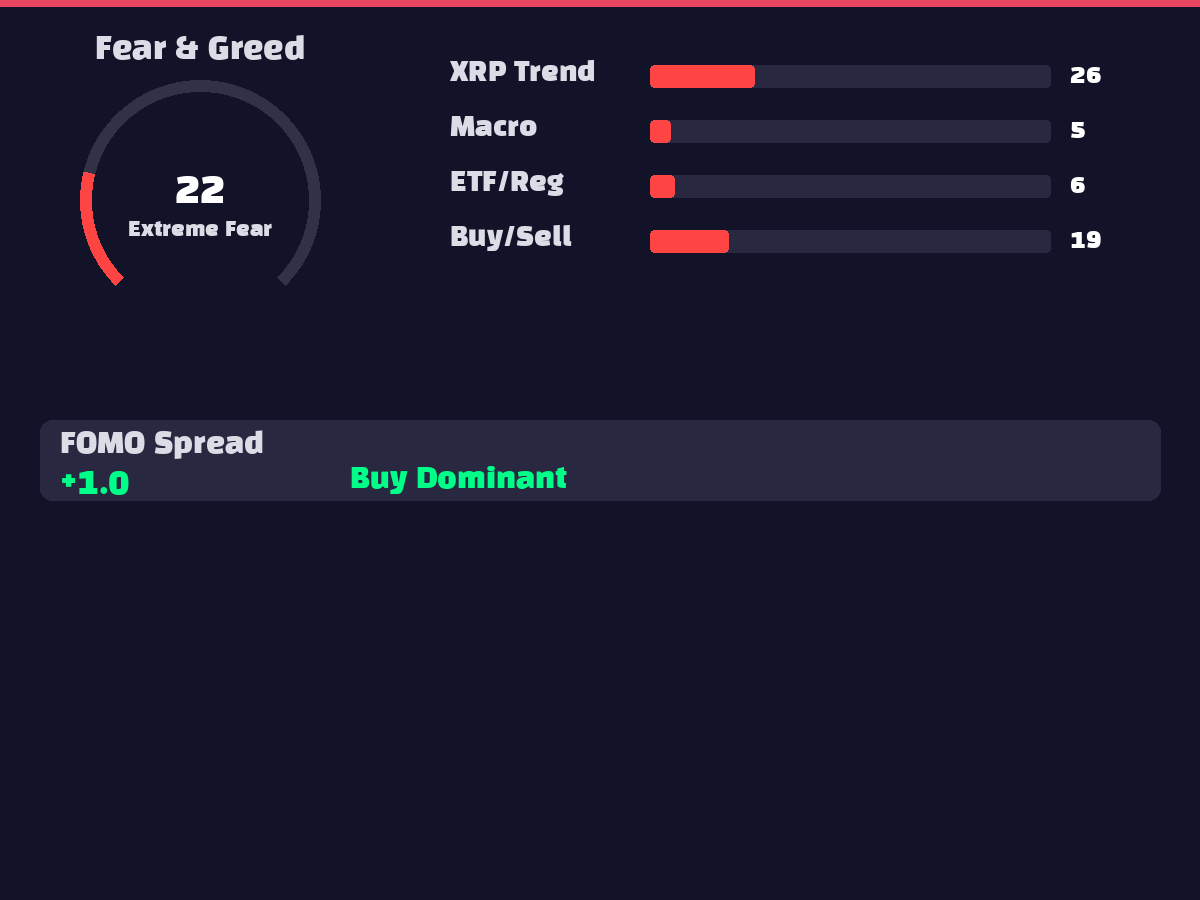
The Fear & Greed Index stands at 10, indicating extreme fear conditions. ETF/regulatory trends(14) and FOMO spread(1.0) remain at low levels. Glassnode analysis shows XRP holders exhibiting "intense capitulation" signals as they crystallize losses. A whale opened a $1.49 million short position on XRP, reflecting bearish sentiment. However, some market participants are focusing on Google Gemini AI's bullish long-term predictions.
6. 🐋 On-Chain Activity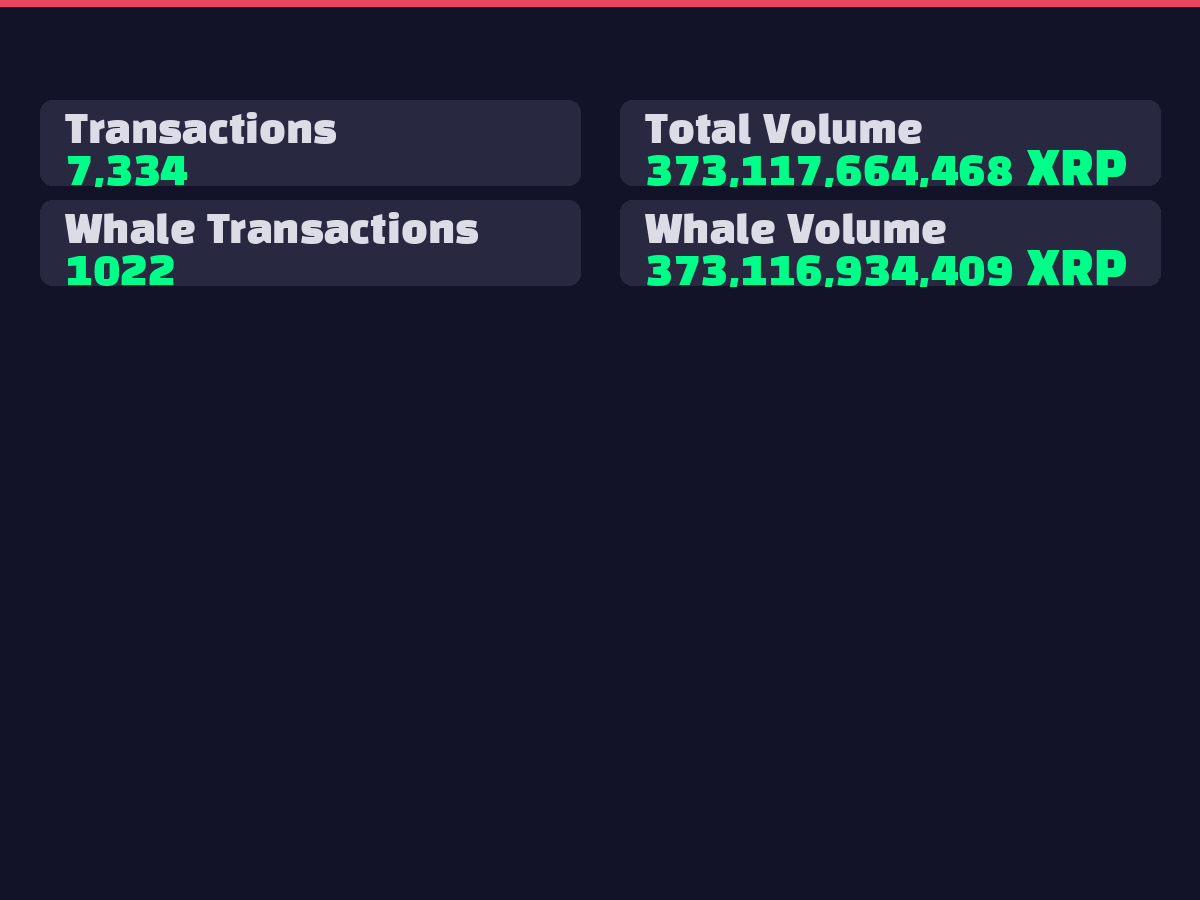
Whale transactions total 1,181 trades involving 464,682,364,799 XRP, representing a significant portion of total volume. With 7,169 total transactions, network activity remains steady, but large-scale whale movements are increasing price volatility. Persistent selling pressure from major holders is contributing to market instability.
7. 📈 Elliott Wave / Wyckoff Analysis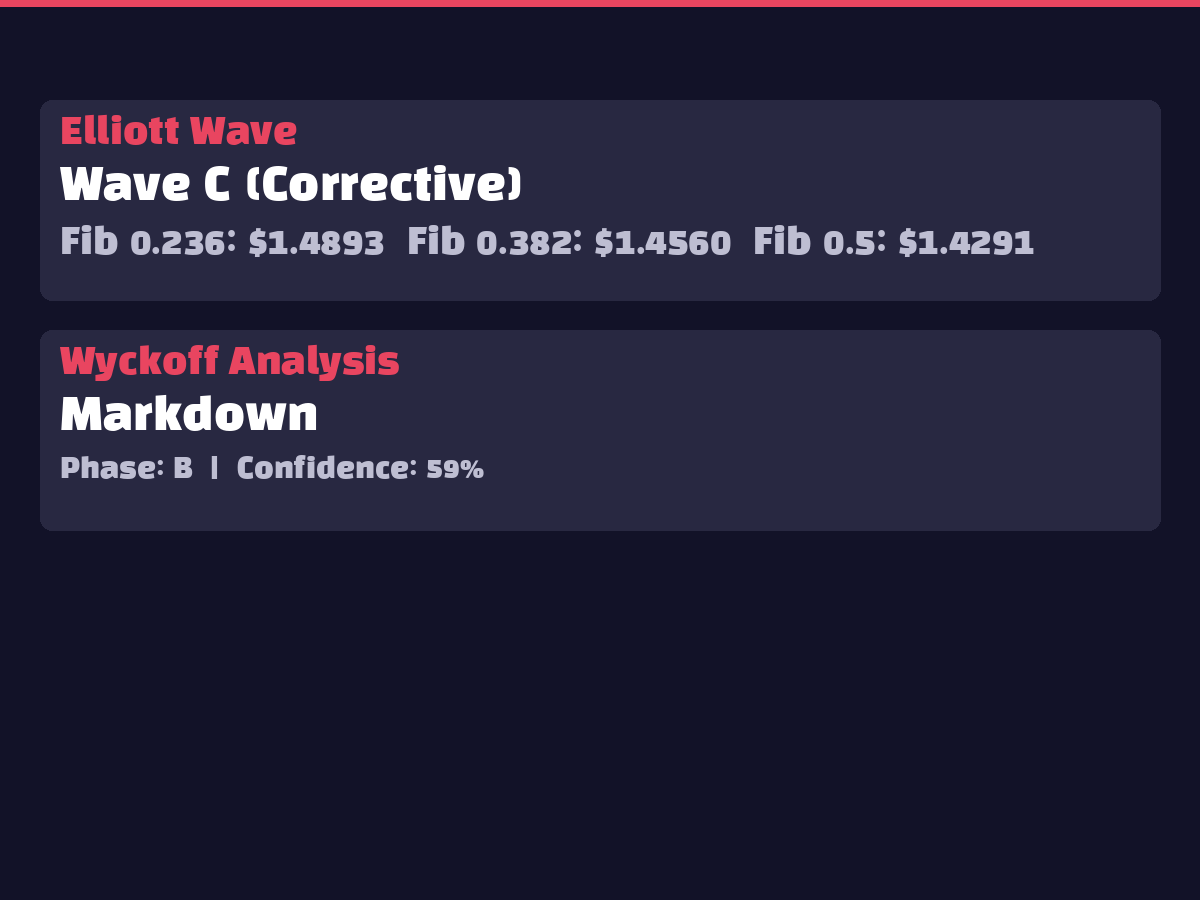
Elliott Wave analysis places XRP in a C-wave (corrective) phase, while Wyckoff analysis indicates a Markdown phase, stage A, with 64% confidence. This suggests the early stages of a major downtrend with expected additional corrective pressure. Future trend reversal possibilities will depend on support level tests and subsequent reactions.
8. 🤖 AI Prediction Interpretation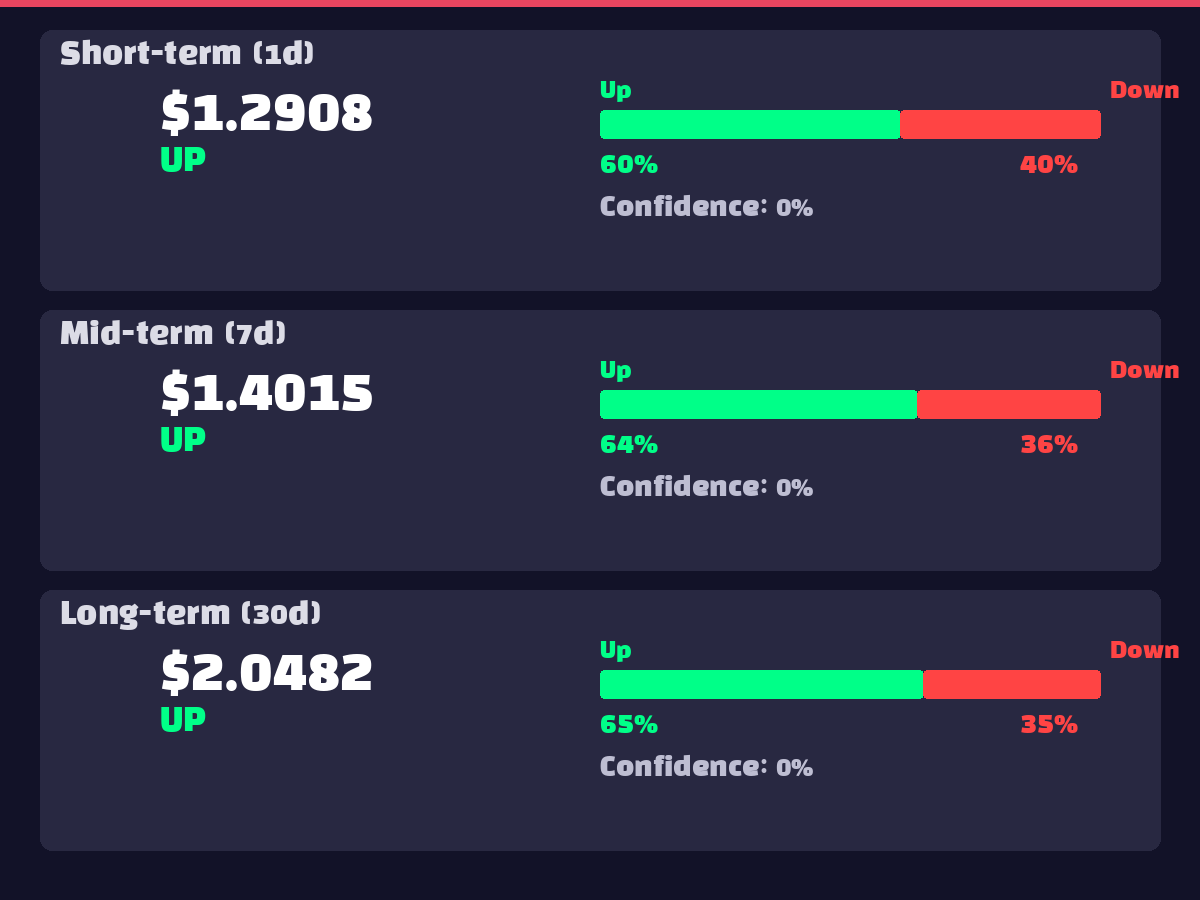
AI ensemble models predict upward movement across all timeframes: short-term(1-day) $1.5332 (60.8% up probability), medium-term(7-day) $1.4392 (62.0% up probability), and long-term(30-day) $1.9753 (82.4% up probability). The increasing bullish confidence over longer timeframes suggests potential technical recovery, with the 35% short-term upside from current levels indicating possible bounce potential. The 82.4% long-term probability is particularly noteworthy.
9. ⚠️ Risk Factors
10. ✅ Overall Assessment
Recommendation: Watch and Accumulate on Dips
Rationale:
Trading Strategy:
While the probability of entering a recovery phase after sharp correction is high, we recommend a cautious dollar-cost averaging approach considering macroeconomic uncertainties and whale selling pressure.