XRP Market Analysis Report
Analysis Time: June 11, 2026, 16:49 (KST) / June 11, 2026, 07:49 (UTC)
1. 📌 Market Summary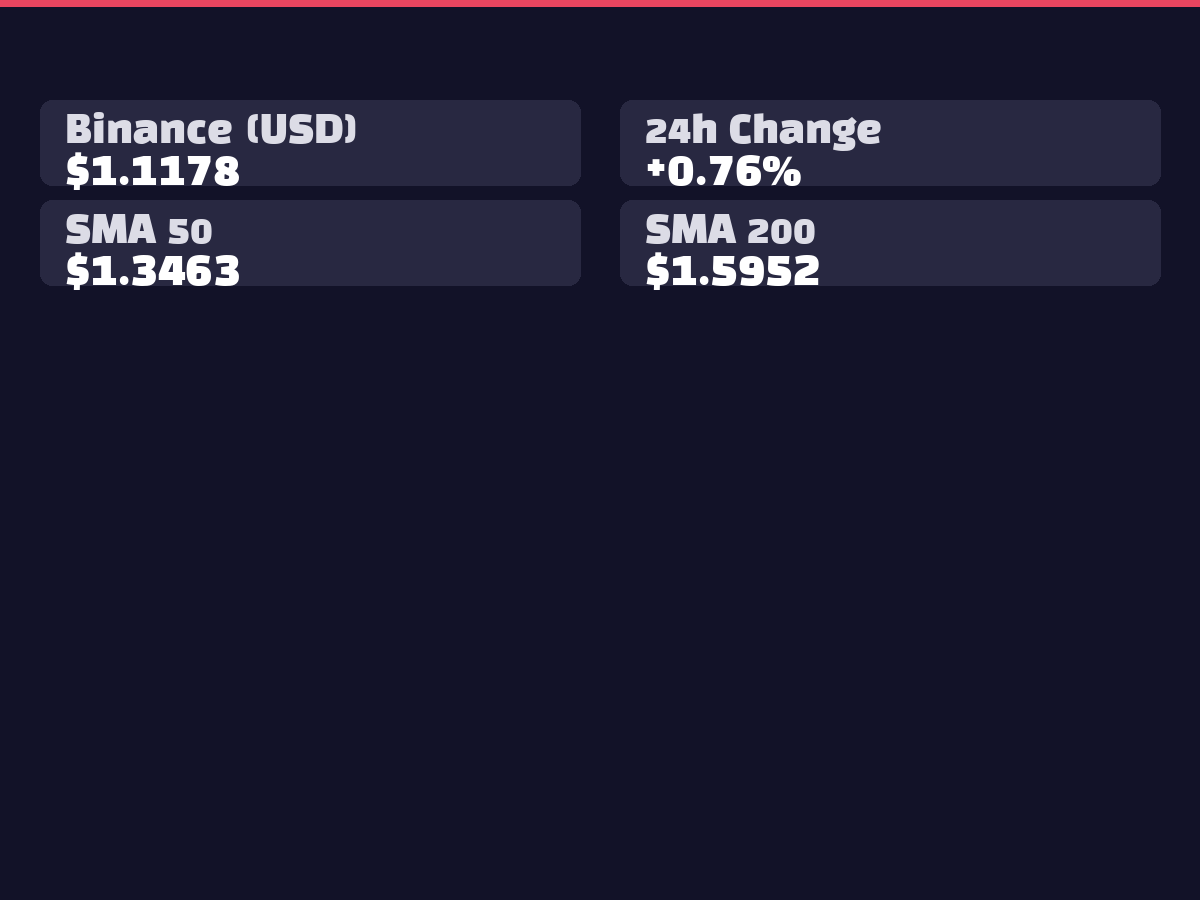
XRP is currently trading at $1.1146 on Binance with a 24-hour decline of -0.34%. On Bithumb, it's trading at ₩1,678 with a -0.06% change. With an RSI of 28.86, XRP has entered oversold territory and is trading below all major moving averages, indicating continued short-term bearish momentum. However, AI prediction models forecast a strong bullish reversal with short-term (1-day) target of $1.5837 and medium-term (7-day) target of $1.7294, suggesting high probability of rebound from current price levels.
2. 📊 Technical Analysis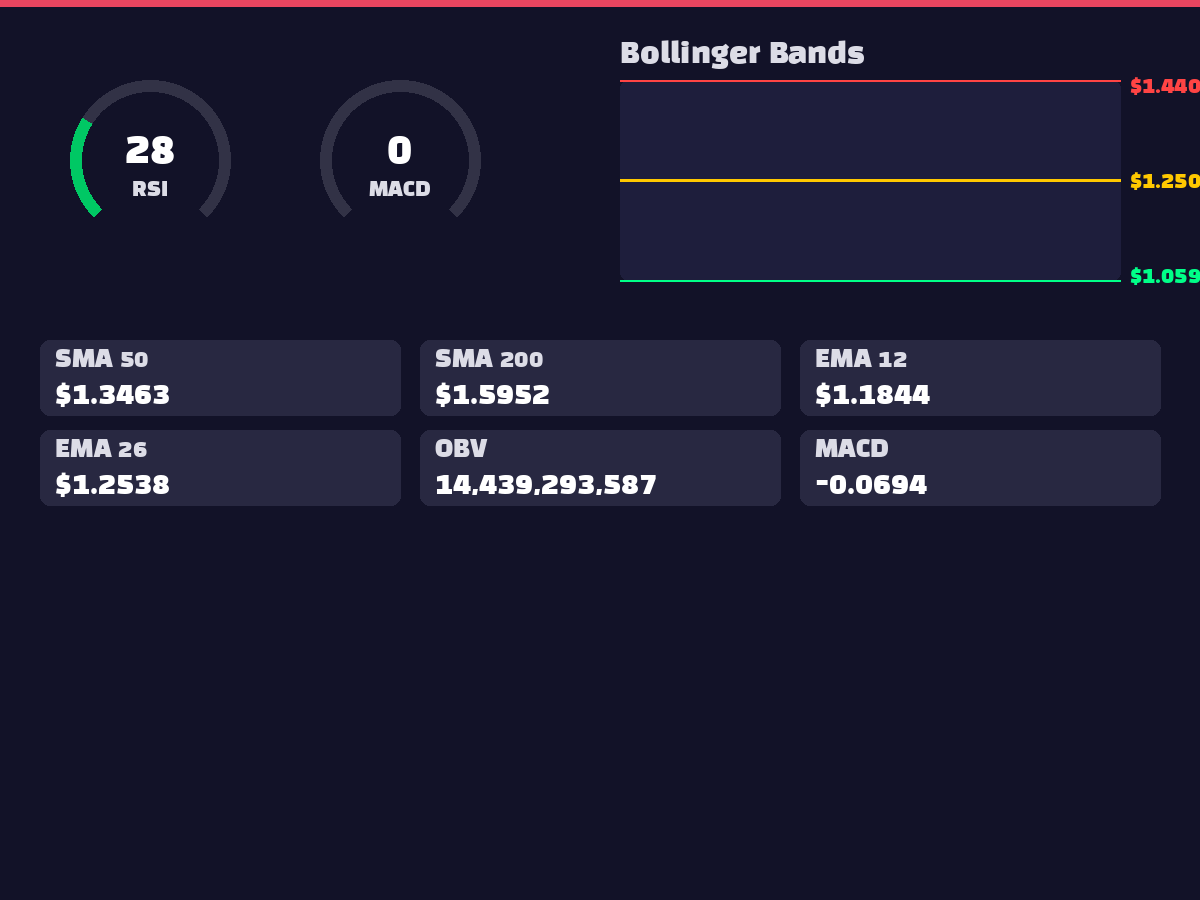
XRP is currently showing strong oversold signals across multiple indicators. The RSI at 28.86 sits well below the 30 threshold, indicating classic oversold conditions. MACD at -0.0694 remains below the signal line (-0.0565) with a histogram of -0.0129, confirming continued bearish momentum. The price is finding support near the lower Bollinger Band (1.0595), approximately 11% below the middle line (1.2501). Displacement ratios show significant deviation from major moving averages: -18.07% from 50-day, -19.24% from 100-day, and -30.85% from 200-day MA. The OBV indicator at 14,439,293,587 suggests a divergence between volume and price action, potentially signaling an upcoming reversal.
3. 🌍 International Geopolitics & Macroeconomics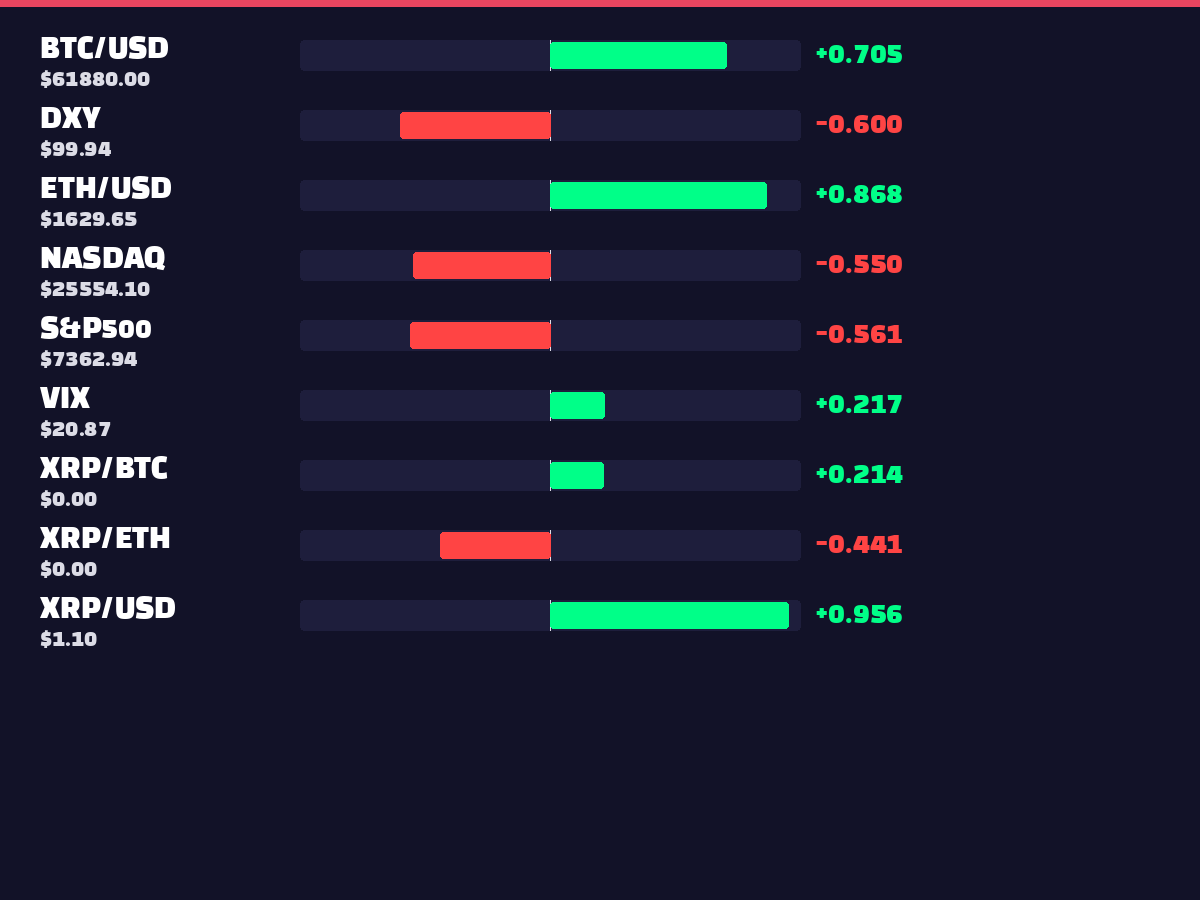
No major international geopolitical developments were identified in the current news collection. Correlation asset analysis reveals a -0.6003 negative correlation with DXY, suggesting XRP could benefit from dollar weakness. The DXY currently trades at 99.94. XRP shows negative correlations with major equity indices (S&P500: -0.5608, NASDAQ: -0.5498), indicating independent movement from traditional assets. A positive correlation of 0.2899 with the VIX suggests XRP tends to rise during periods of increased market volatility.
4. ⚖️ Regulatory & Legal Environment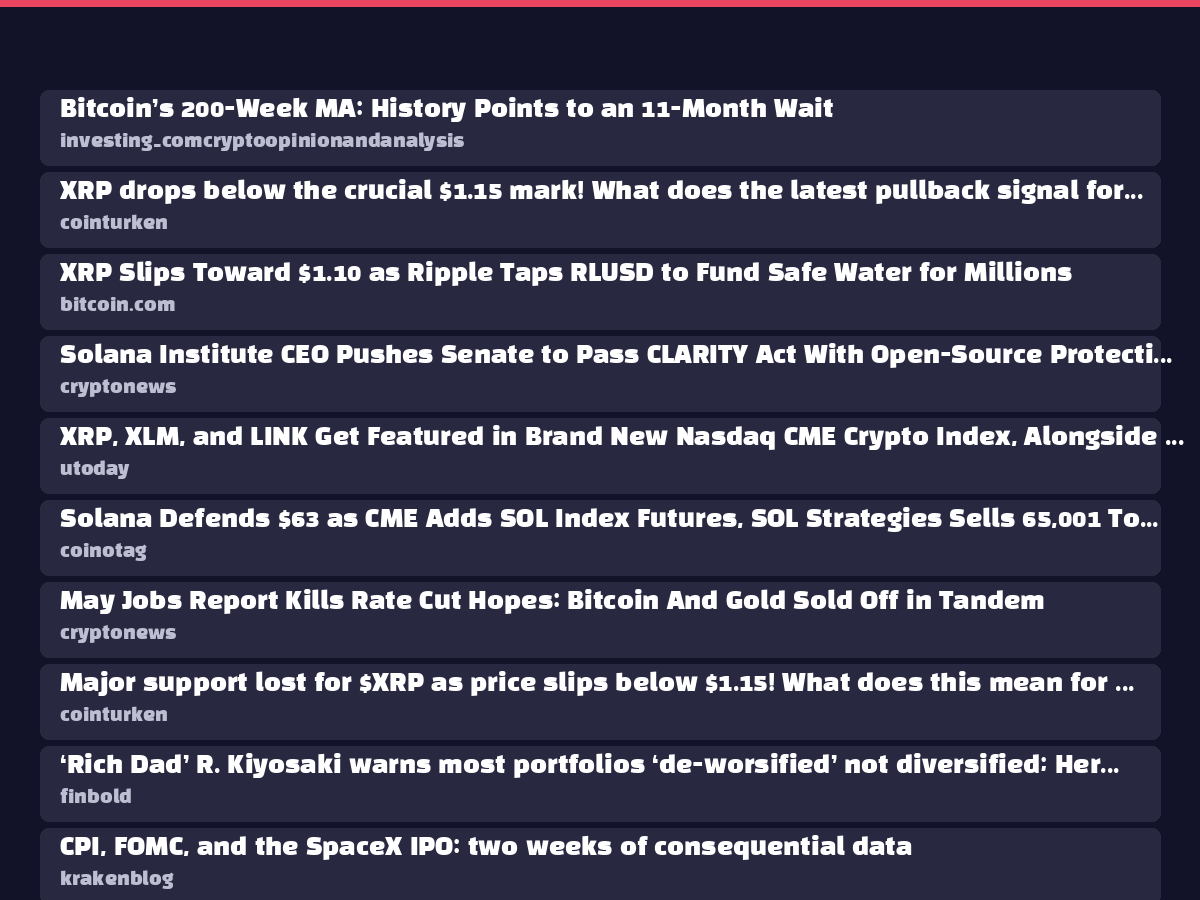
No significant regulatory developments were identified in the current news collection. XRP ETF flows show broad-based outflows across all products: XRPT (-$3.0M), XRPI (-$1.1M), XXRP (-$5.9M), XRPR (-$0.1M), XRPZ (-$2.4M), and XRP (-$5.3M). Total net outflows of approximately $17.8M indicate continued institutional selling pressure in the short term.
5. 😱 Market Sentiment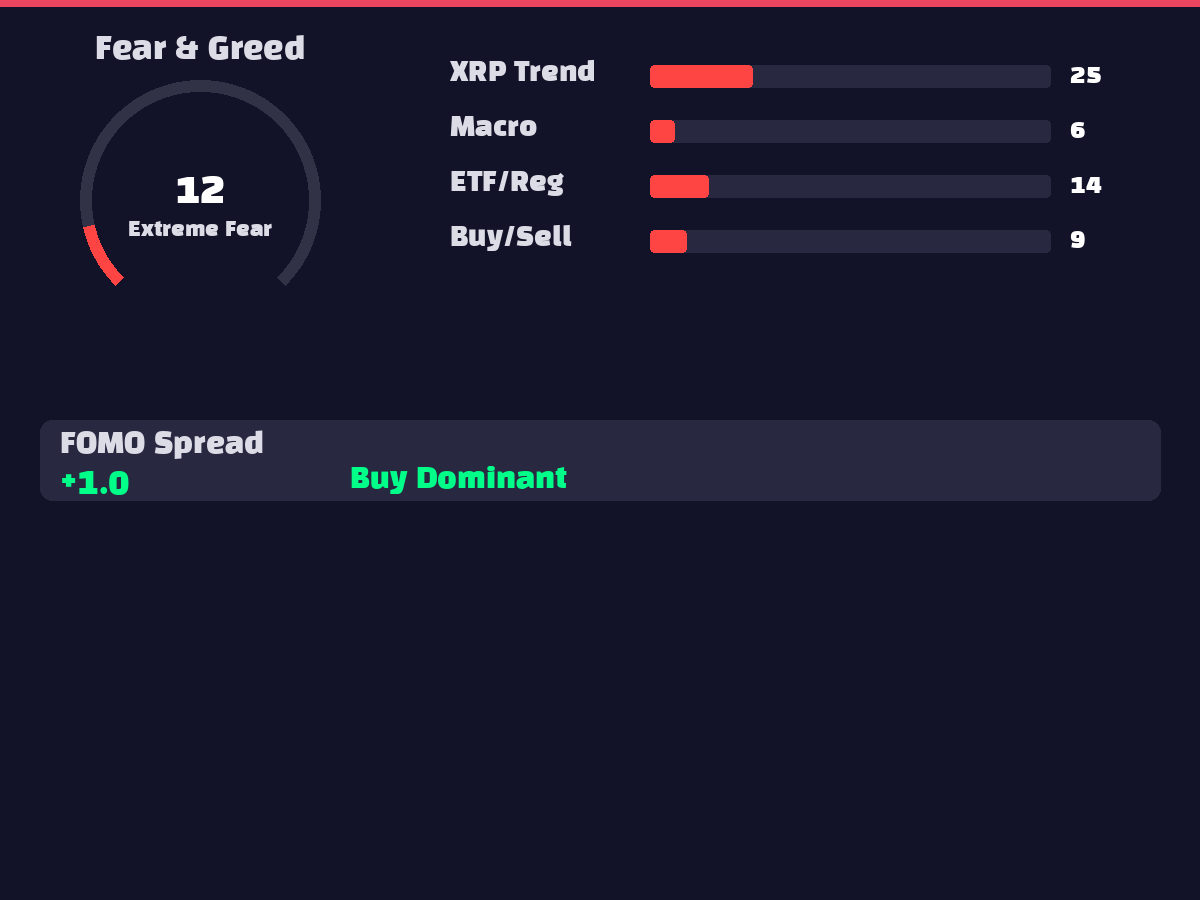
Market sentiment remains extremely negative. The Fear & Greed Index at 12 indicates "Extreme Fear" conditions. XRP search trends at 26 reflect diminished retail interest. Macroeconomic trends (6) and ETF/regulatory trends (15) both register low readings. The FOMO spread at 1.0 suggests minimal buying enthusiasm. The XRP/BTC interest ratio of 1.5143 shows relatively higher attention compared to Bitcoin, though overall market sentiment remains deeply bearish.
6. 🐋 On-Chain Activity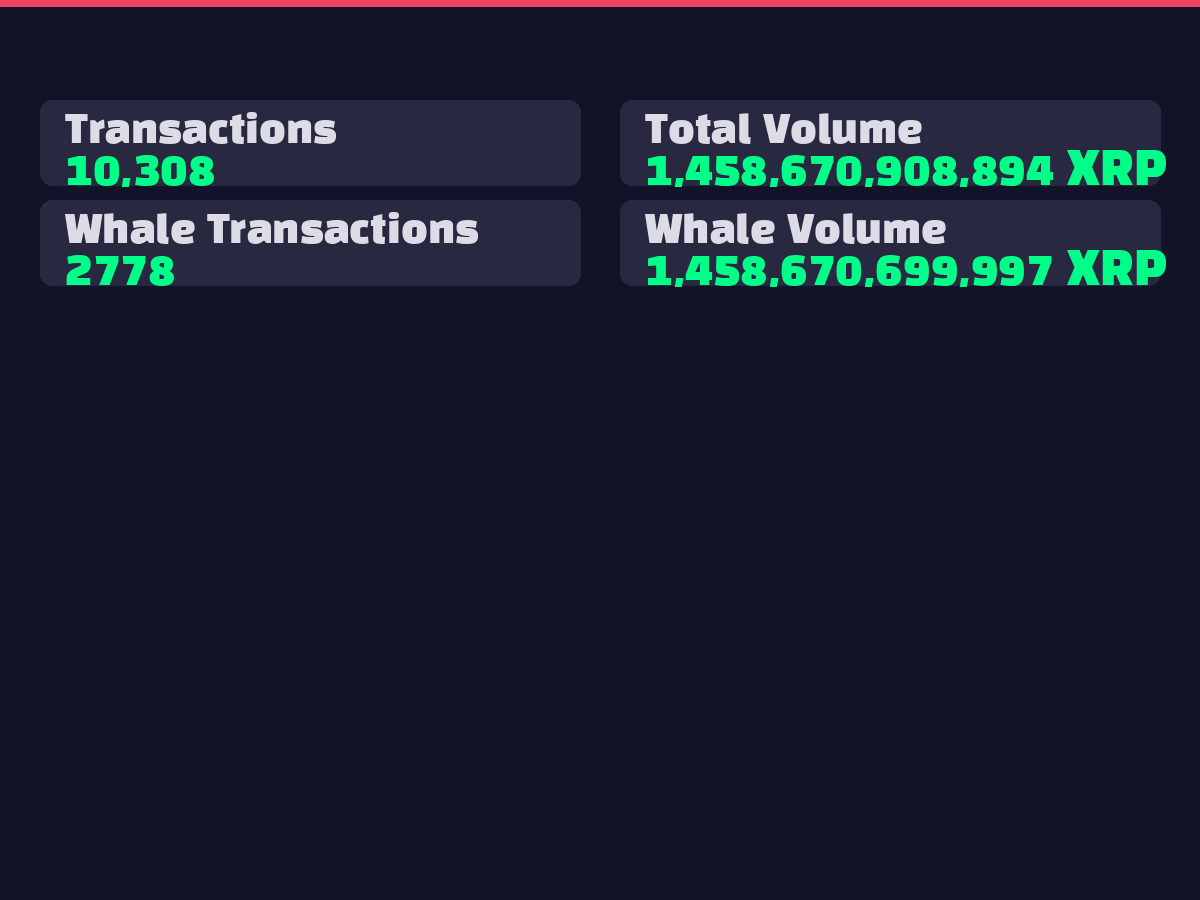
On-chain data reveals significant activity levels. Total transaction count reached 10,308 with a massive transaction volume of 1,458,670,908,894 XRP. Notably, whale transactions numbered 2,778, representing approximately 27% of total transactions. Whale transaction volume of 1,458,670,699,997 XRP accounts for nearly 100% of total volume, indicating the market is heavily influenced by large investor movements. This concentration suggests potential for increased volatility and rapid price reversals.
7. 📈 Elliott Wave / Wyckoff Analysis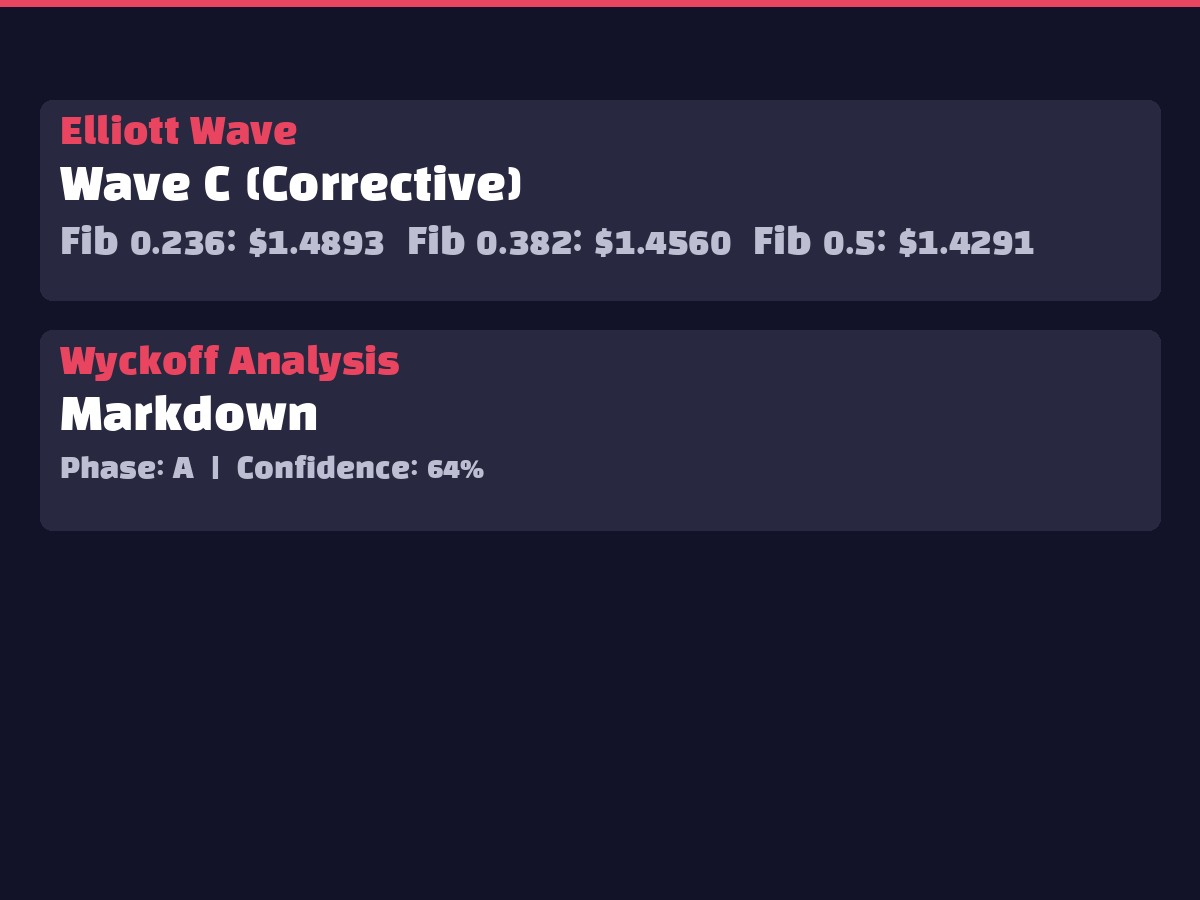
Elliott Wave analysis places XRP currently in a C-wave corrective phase. Wyckoff analysis identifies the market in the Markdown phase, specifically in stage A, with 64% confidence. This represents a transition from early to intermediate stages of the downtrend. Markdown Phase A typically involves smart money distribution, with potential progression to Phase B (technical rally) or Phase C (final capitulation). Given current oversold conditions, a Phase B technical rebound appears likely in the near term.
8. 🤖 AI Prediction Analysis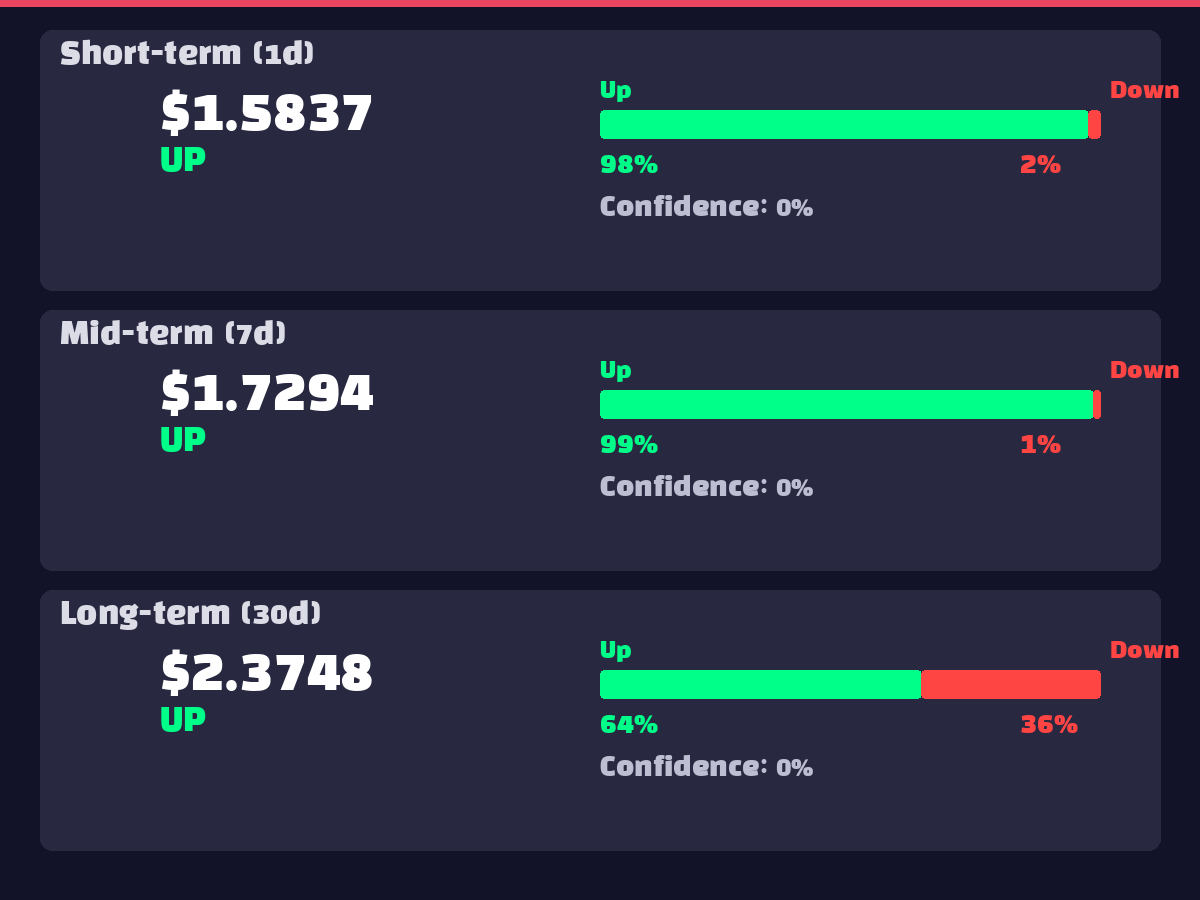
AI ensemble models present remarkably bullish forecasts. Short-term (1-day) prediction of $1.5837 represents a 42% upside with 97.7% probability of upward movement. Medium-term (7-day) forecast of $1.7294 suggests 55% gains with an even higher 98.8% upward probability. Long-term (30-day) prediction of $2.3748 implies 113% gains, though with reduced confidence at 64.3% upward probability. This pattern suggests strong near-term rebound potential with increasing uncertainty over longer timeframes. KRW targets stand at ₩2,384 (short-term), ₩2,604 (medium-term), and ₩3,575 (long-term).
9. ⚠️ Risk Factors
10. ✅ Overall Recommendation
Recommendation: Staged Accumulation
Current XRP conditions favor a staged accumulation strategy given oversold conditions and strong reversal signals.
Rationale:
Strategic Implementation:
The current risk-reward profile appears highly favorable, and a dollar-cost averaging approach can effectively manage downside risk while positioning for the anticipated bullish reversal.