1. 📌 Market Summary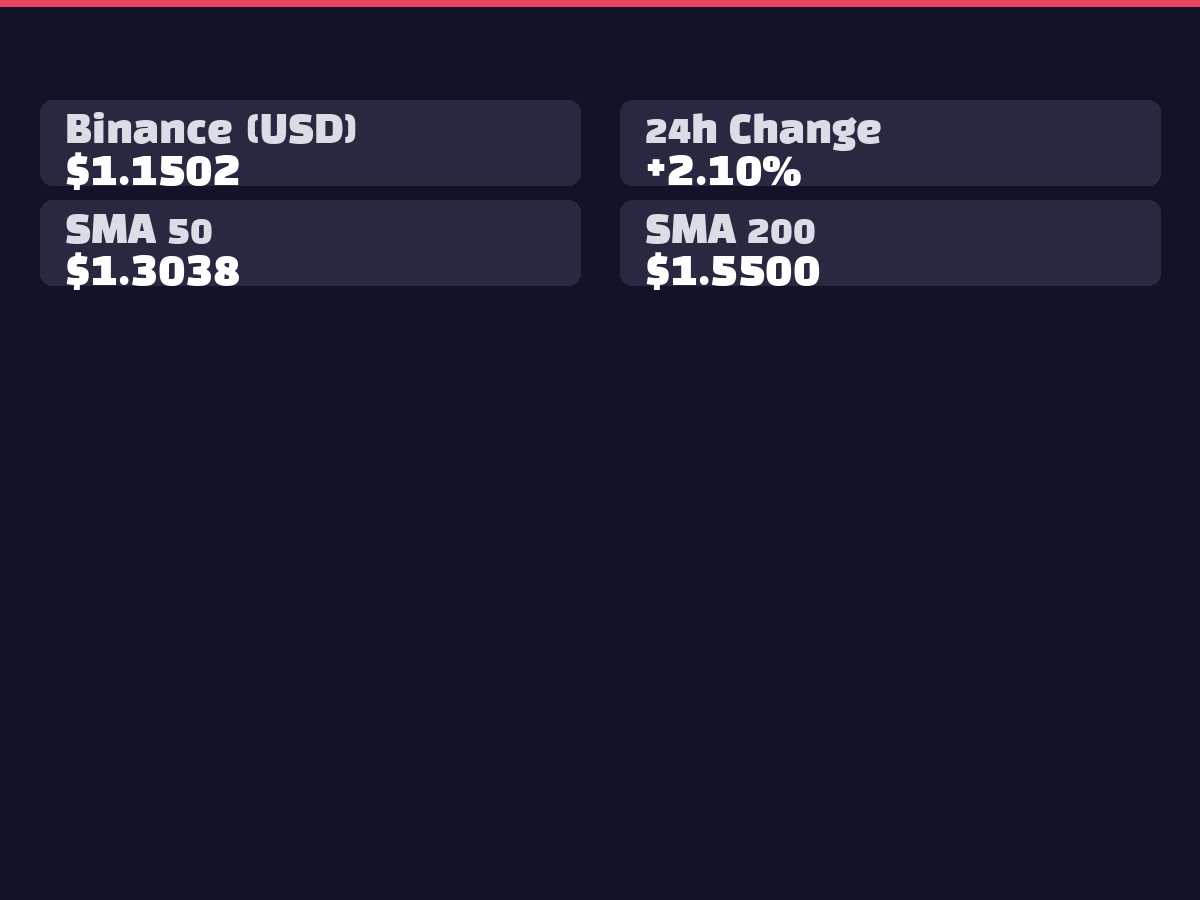
XRP is currently trading at $1.1336, down -1.49% over the past 24 hours. The Bithumb KRW price stands at ₩1,712, recording a -1.55% decline. With RSI at 40.04 approaching oversold territory, all seven XRP ETFs experienced net outflows totaling -$20.3M. Whale trading volume reached 1.177 trillion XRP, indicating significant large investor activity in the market.
2. 📊 Technical Analysis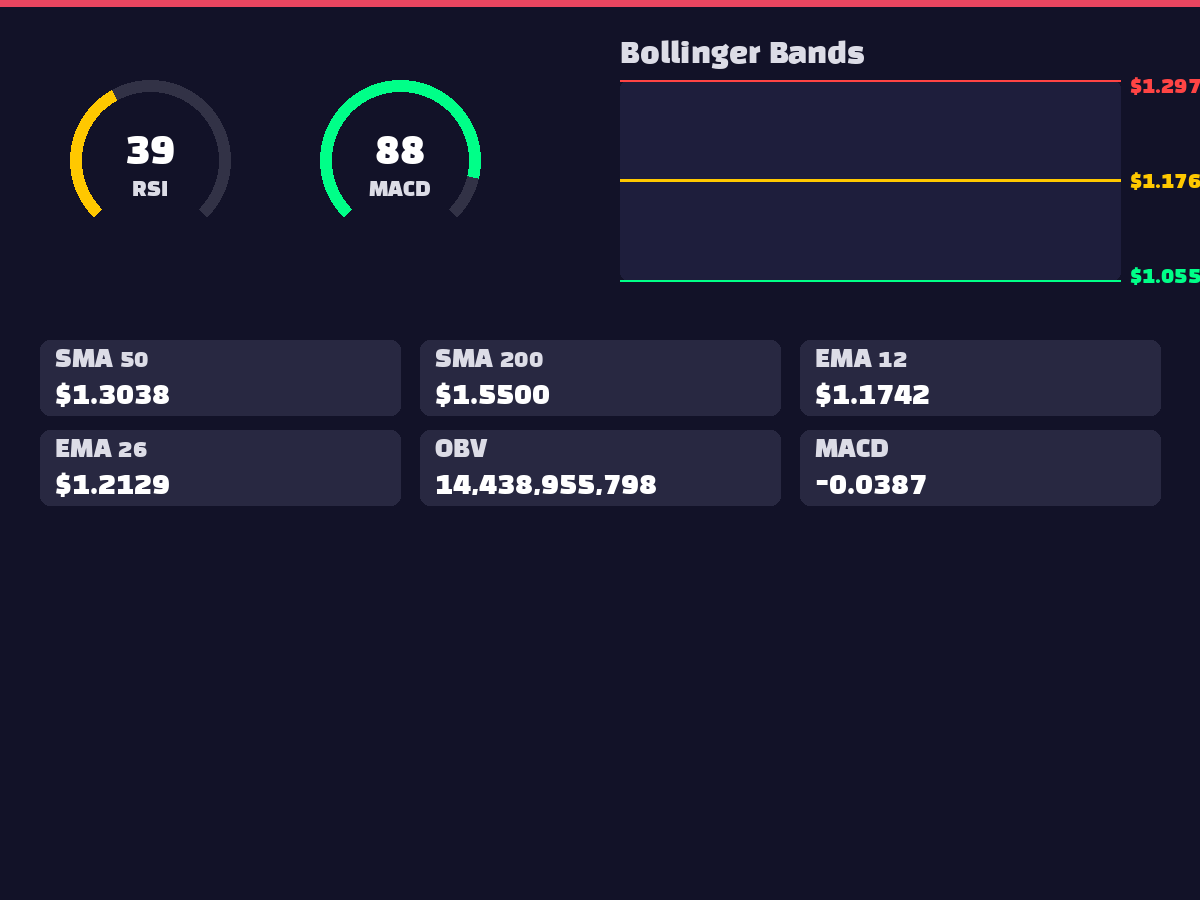
Current technical indicators are displaying bearish signals. The RSI at 40.04 sits in the lower neutral zone, suggesting potential entry into oversold territory. The MACD at -0.0382 remains above the signal line at -0.0482, with a positive histogram of 0.0100 indicating possible short-term bounce potential. According to Bollinger Bands, the current price is moving from the middle band at 1.1864 toward the lower band at 1.0477. Moving average analysis shows negative divergence across all timeframes: 50-day (-12.53%), 100-day (-15.20%), and 200-day (-26.40%), confirming the continuation of medium to long-term bearish trends. The OBV at 14,440,883,174 indicates weakening volume-based buying pressure.
3. 🌍 International Situation and Macroeconomic Environment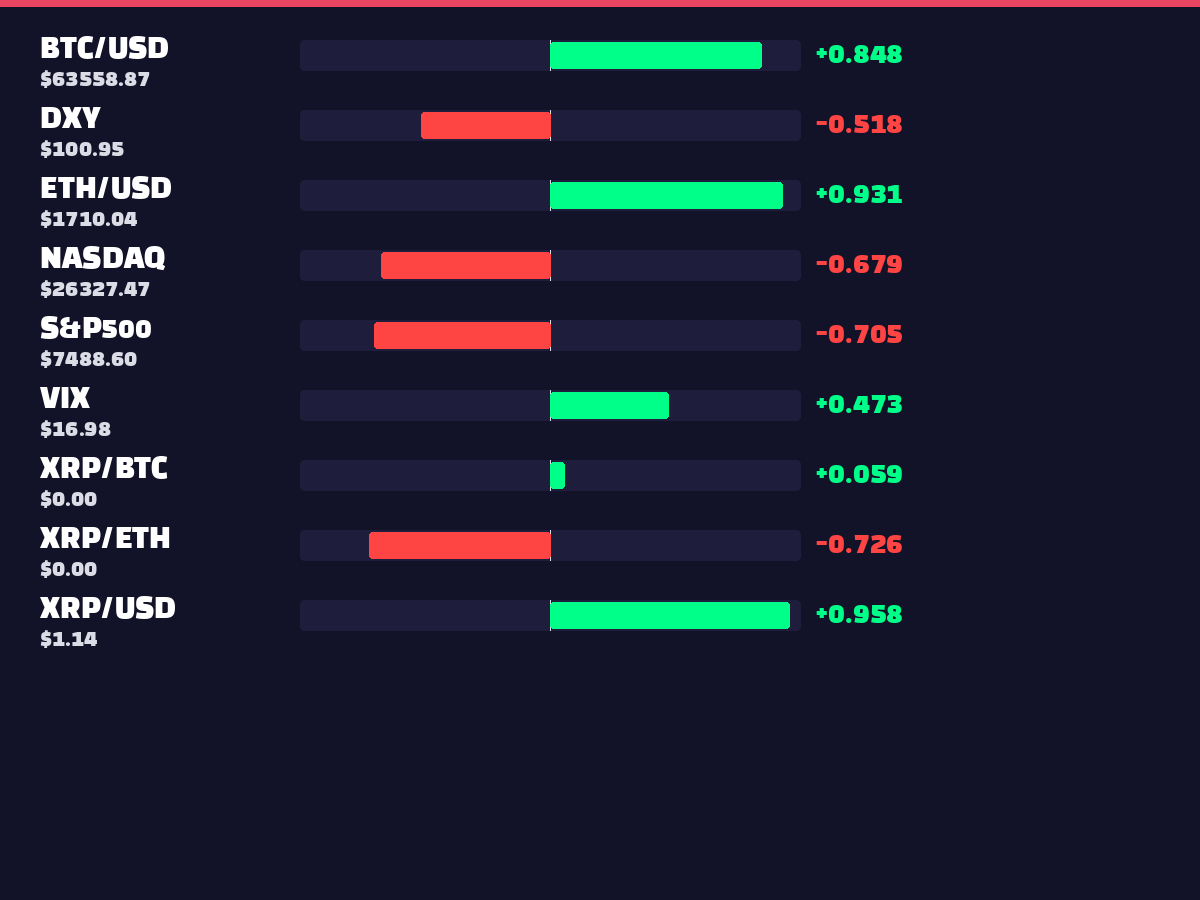
Based on collected correlation data, XRP shows a -0.5533 inverse correlation with the DXY, and the current dollar index strength at 100.9490 is pressuring XRP prices. Strong inverse correlations with S&P500 (-0.6822) and NASDAQ (-0.6540) suggest that traditional financial market gains are leading to cryptocurrency fund outflows. The 0.4326 correlation with VIX at 16.9800 indicates that market instability is contributing to increased XRP volatility. Recent news revealed that SWIFT announced the end of support for unstructured addresses in CBPR+ messages from November 2026, signaling changes in traditional payment systems.
4. ⚖️ Regulatory and Legal Environment
Key regulatory developments confirmed in recent news include the CFTC mapping a path for decentralized perpetual futures venues like Hyperliquid to operate legally. Additionally, a Fox News clip featuring Senator Bill Hagerty discussing the CLARITY Act has gained attention in the crypto community, being viewed as a supportive factor for XRP and XLM outlook. FBI data revealing $11 billion in crypto-related scam losses in the US suggests heightened regulatory scrutiny ahead.
5. 😱 Market Sentiment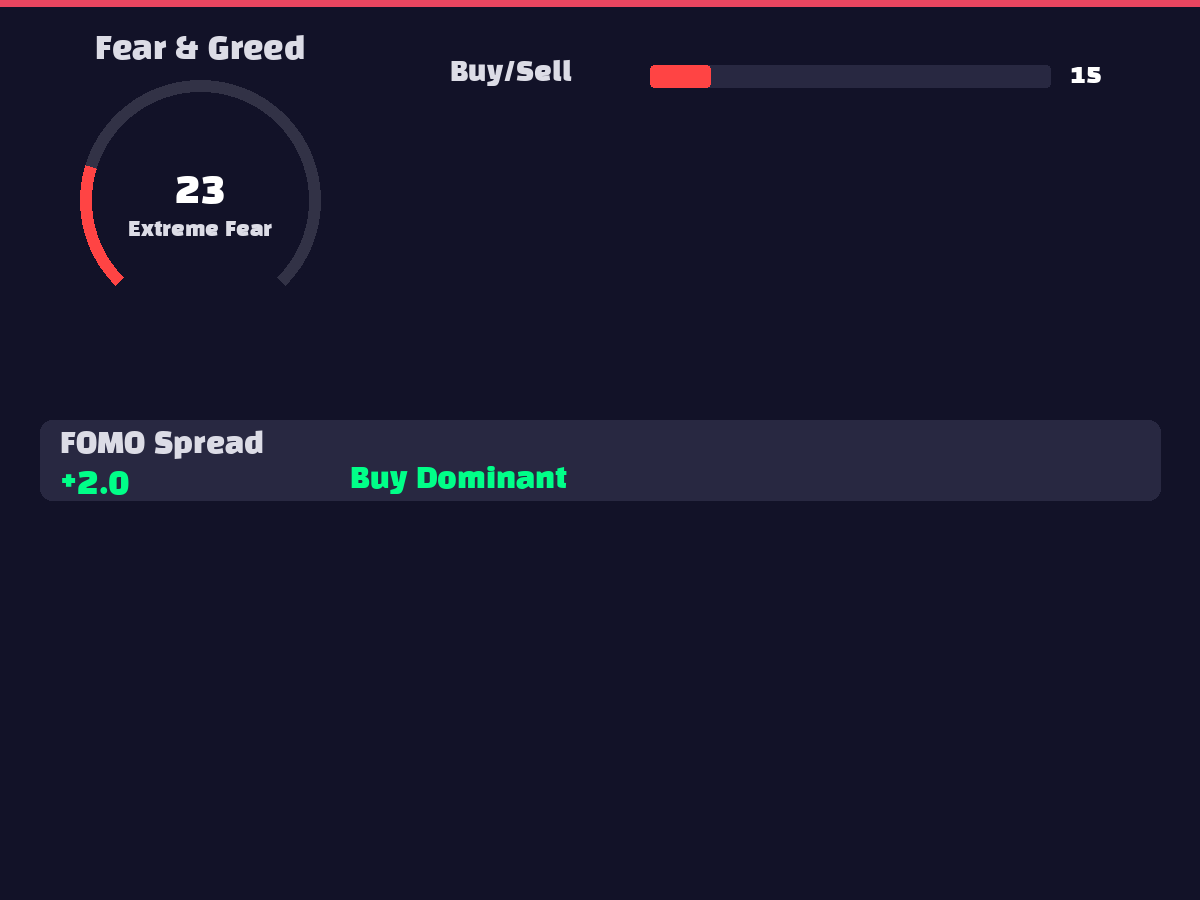
Market sentiment indicators reflect extreme fear conditions. The Fear & Greed Index at 14 positions in the "Extreme Fear" zone, suggesting potential panic selling. XRP search trends at 26 indicate considerably low public interest, while macroeconomic trends at 5 and ETF/regulatory trends at 6 also show minimal attention. The FOMO spread of 2.0 signifies very weak buying enthusiasm, and the XRP/BTC interest ratio of 0.8254 indicates insufficient relative interest in XRP compared to Bitcoin. These indicators collectively suggest the market may be near bottom levels.
6. 🐋 On-Chain Activity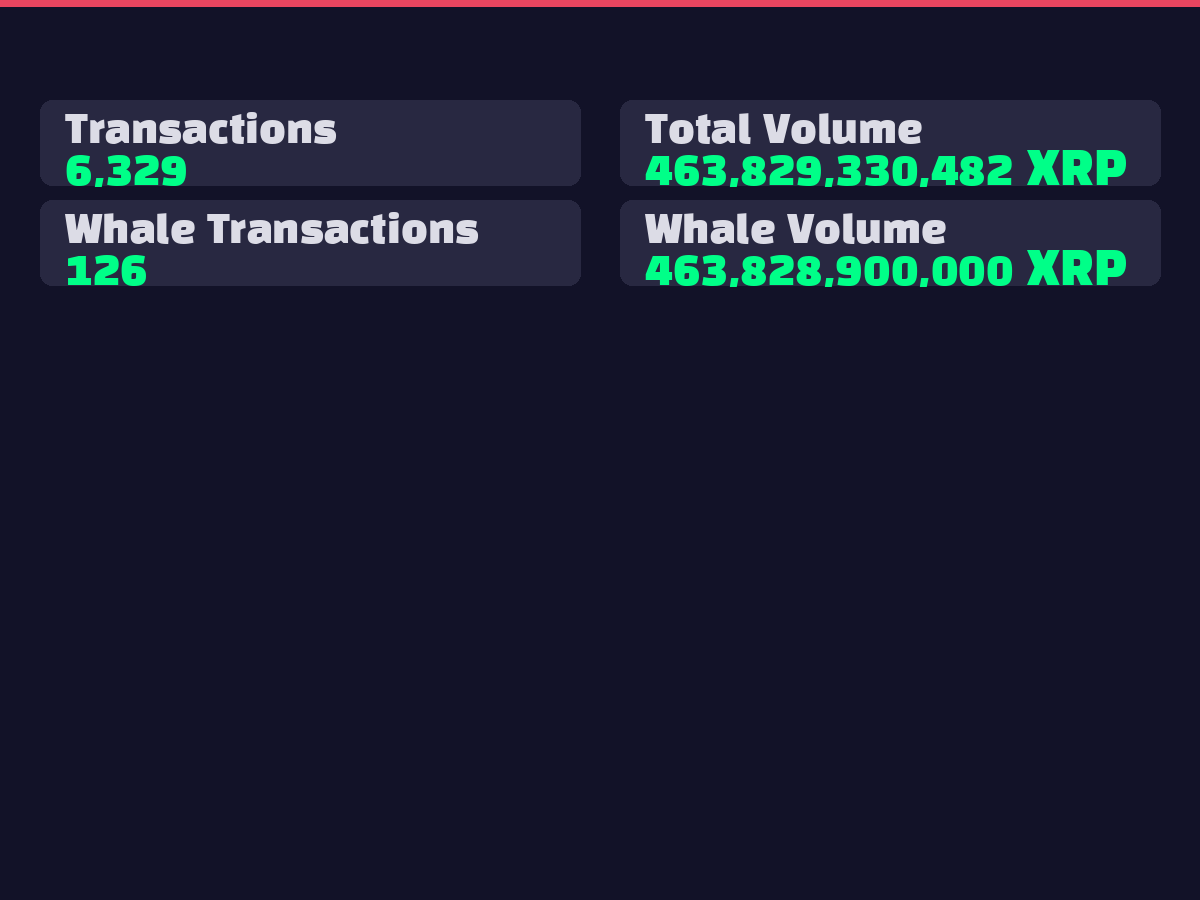
On-chain data reveals active large investor movements. Whale transactions account for 1,418 out of 6,834 total transactions (approximately 20.7%), while by volume, whale trading represents nearly the entire 1.177 trillion XRP in total trading volume. CryptoQuant data showing XRP outflows from Coinbase hitting their highest levels since April, with synchronized withdrawals across major exchanges, indicates active institutional fund movements. Notably, Tokyo-listed game company Gumi's announcement to consolidate ¥14 billion (approximately $90 million) worth of XRP to become Japan's largest institutional holder represents a positive signal.
7. 📈 Elliott Wave / Wyckoff Analysis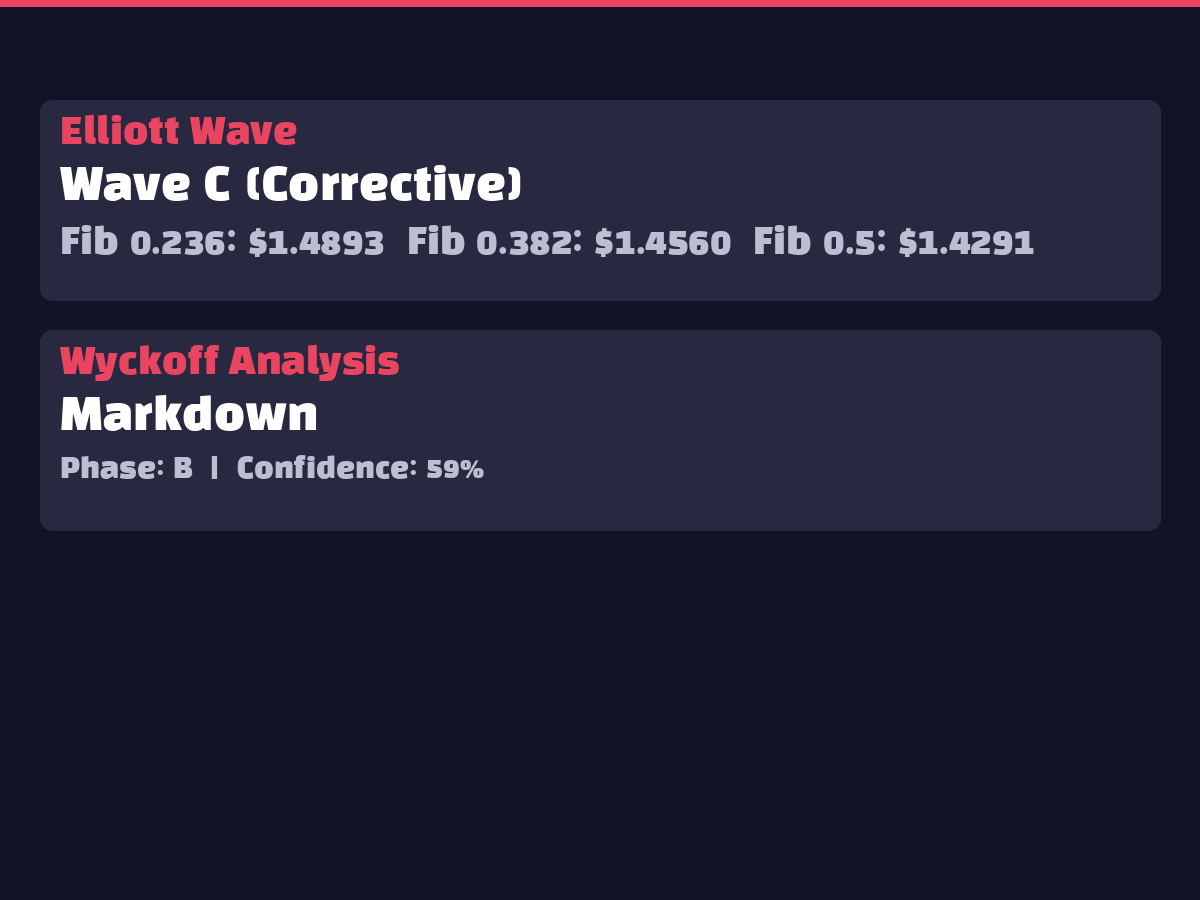
Current Elliott Wave analysis indicates a C-wave corrective phase. Wyckoff analysis classifies the market in the Markdown phase, specifically stage B, with 59% confidence. Markdown represents the price decline phase following distribution, suggesting large investors are currently disposing of their holdings. Stage B can feature temporary bounces, but the overall downtrend is likely to persist. The next phase expects entry into stage C with additional declines, followed by bearish continuation until transition to a new accumulation phase.
8. 🤖 AI Prediction Results Interpretation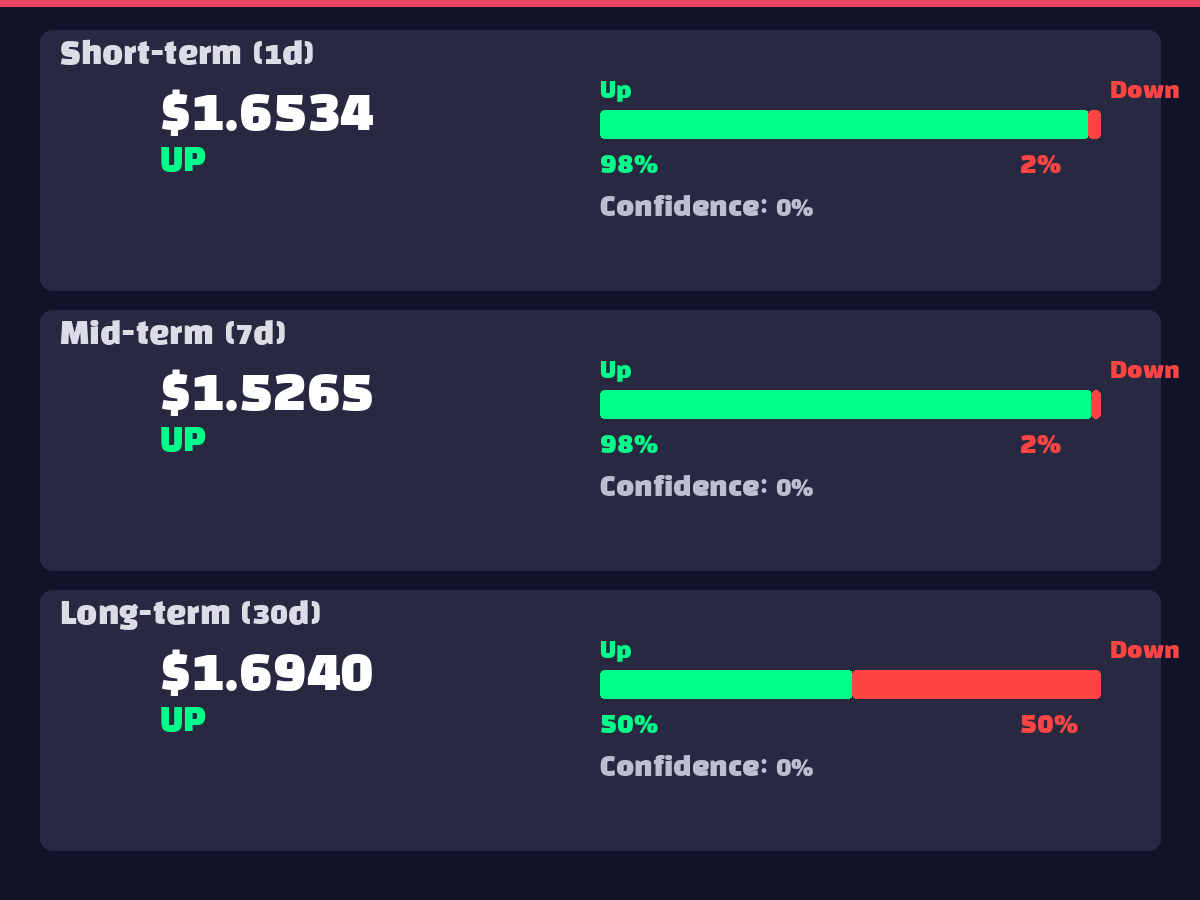
AI ensemble prediction models reveal an interesting pattern. Short-term (1-day) predictions forecast a decline to $1.1047 with 75.2% probability of further downside, suggesting continuation of current bearish momentum. Conversely, medium-term (7-day) predictions anticipate a surge to $1.7996 with 98.7% upward probability, expecting a strong rebound after short-term correction. Long-term (30-day) forecasts $1.7277 with 65.8% upward probability, showing slight moderation from medium-term levels. This suggests a V-shaped recovery pattern, implying rapid recovery once current selling pressure subsides. The pattern of short-term decline followed by medium-term surge reflects institutional buying influx after market bottom formation.
9. ⚠️ Risk Factors
10. ✅ Comprehensive Opinion
Recommendation: Staged Accumulation (Wait and Buy Dips)
XRP currently shows bottom formation signals in oversold territory, presenting an attractive entry opportunity from a medium-term perspective.
Rationale:
Specific Strategy: