1. 📌 Market Summary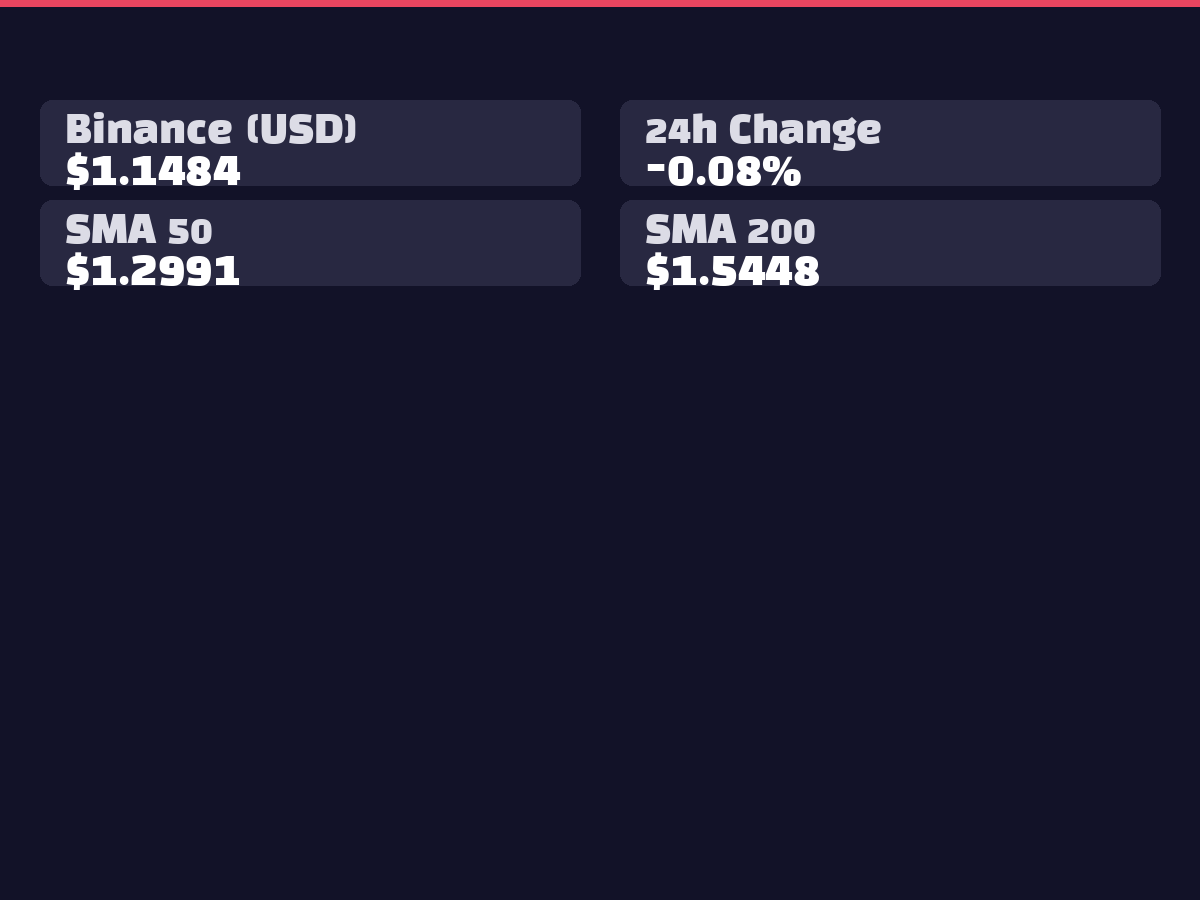
XRP is currently trading at $1.1474 on Binance with a modest 24-hour gain of +0.14%. The Bithumb KRW price stands at ₩1,733, showing a slight decline of -0.06%. Technically, a death cross has been confirmed on short-term charts, indicating continued correction, however, AI prediction models suggest a strong upward potential to $1.4029 in the short term with 97.8% probability. The total $20.3M net outflows from XRP ETFs and the Fear & Greed Index of 23 reflect the current extreme fear sentiment in the market.
2. 📊 Technical Analysis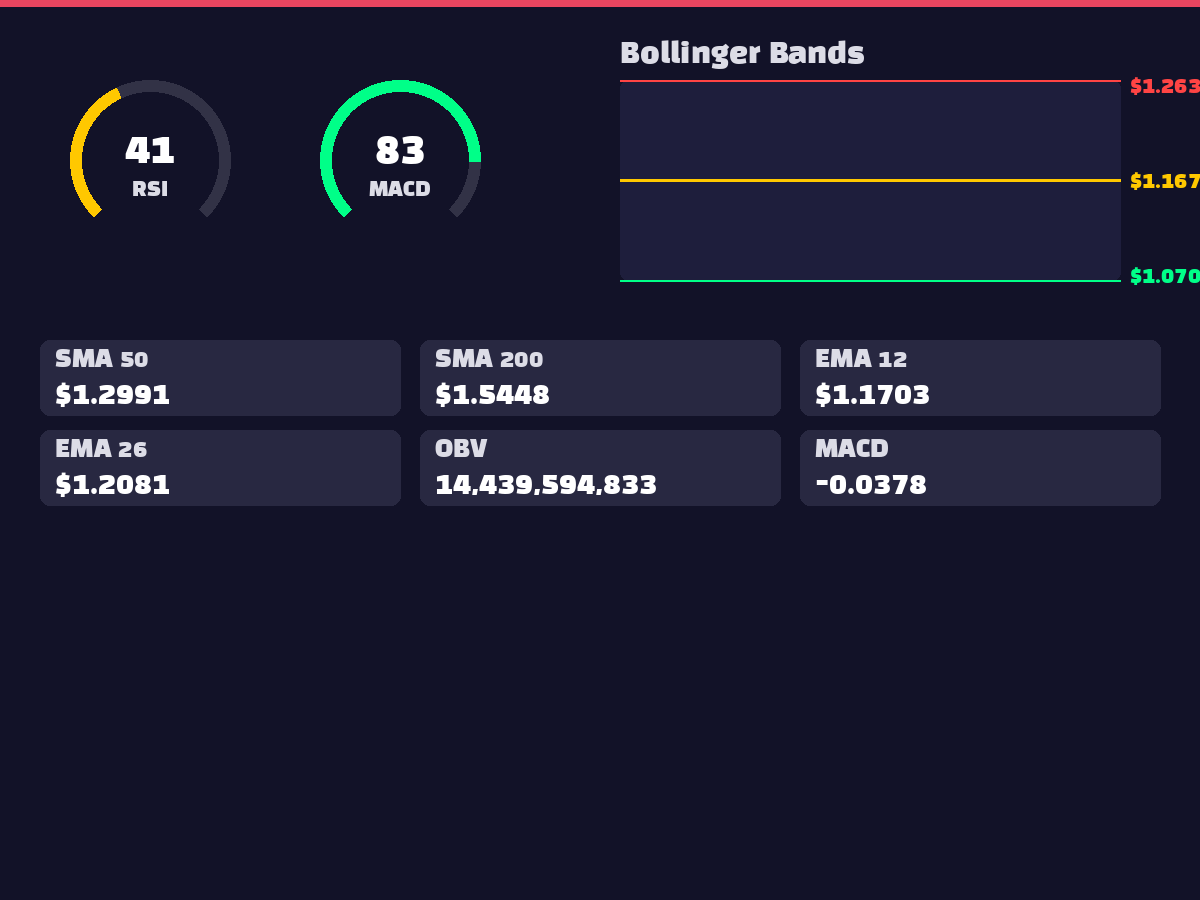
Current technical indicators present mixed signals. The RSI(14) at 41.09 sits in the lower neutral zone, suggesting potential oversold conditions. MACD at -0.0378 remains in negative territory, but the histogram's positive turn to 0.0068 indicates emerging bullish momentum. Within the Bollinger Bands, the current price of $1.1474 trades below the middle line at $1.1670, confirming short-term corrective pressure. Distance analysis shows -11.56% from the 50-day MA and -25.63% from the 200-day MA, indicating substantial correction that provides technical basis for future rebounds. The OBV of 14,439,594,833 demonstrates sustained high trading volume activity.
3. 🌍 International Situation & Macroeconomics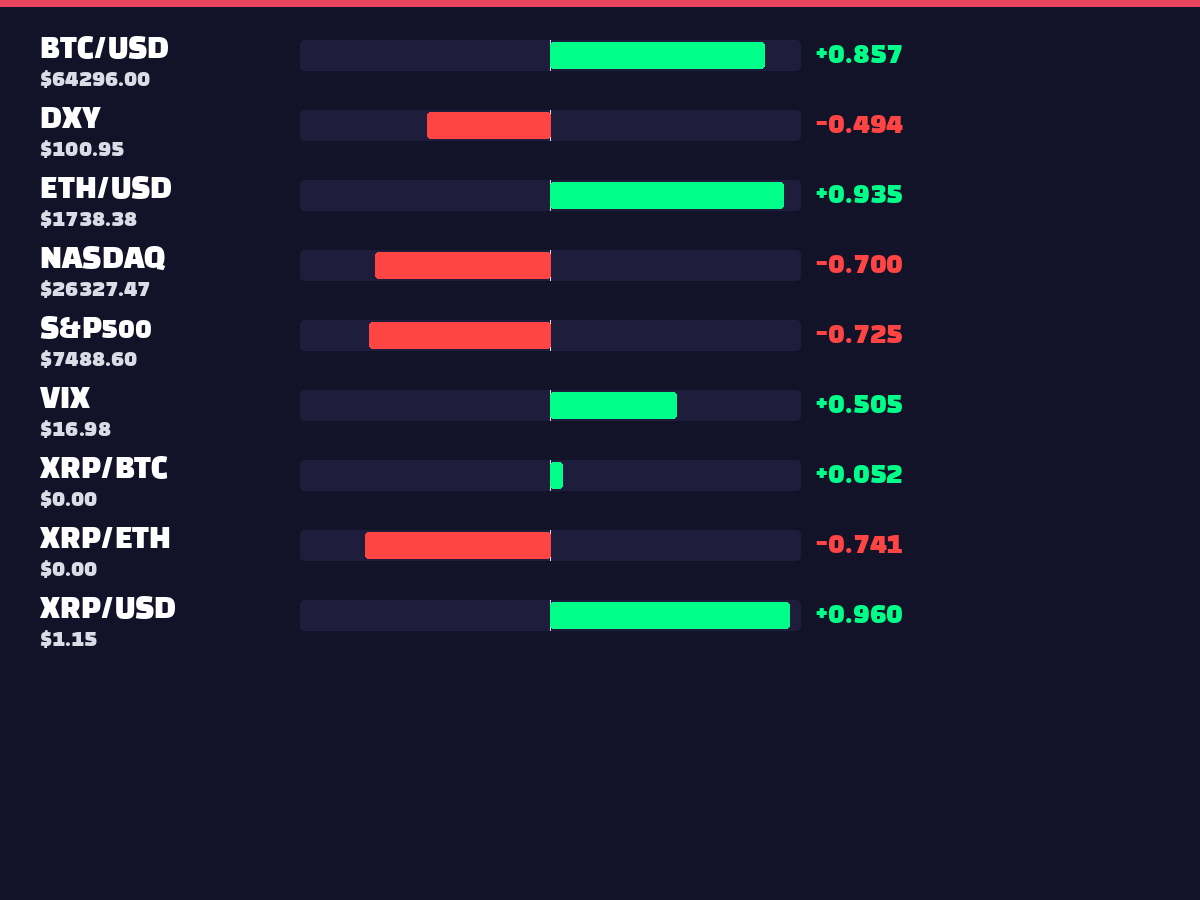
According to latest news, Bitcoin has plummeted below $60,000, declining over 53% from its October highs last year. Iran's order to close the Strait of Hormuz is negatively impacting US-Iran ceasefire negotiations, creating anxiety across the broader cryptocurrency market. Correlation analysis shows XRP maintains high positive correlations with BTC (0.8573) and ETH (0.9346), while exhibiting strong negative correlations with S&P500 (-0.7254) and NASDAQ (-0.7002), demonstrating a contrarian pattern to traditional financial markets. The -0.4949 correlation coefficient with DXY confirms XRP's tendency to weaken during dollar strength periods.
4. ⚖️ Regulatory & Legal Environment
Collected news highlights July 1, 2026, as a crucial regulatory date for Ripple, with potential compliance issues related to California's Digital Asset licensing requirements coming into focus. Additionally, WhiteBIT EU has secured a MiCA license from Austria's Financial Market Authority (FMA), enabling services to 35 million users in the European Economic Area, showing gradual regulatory framework development in Europe. The case of Chinese AI firm Xiao-I losing its first-instance ruling against Apple regarding Siri patent disputes also demonstrates legal risks facing technology companies.
5. 😱 Market Sentiment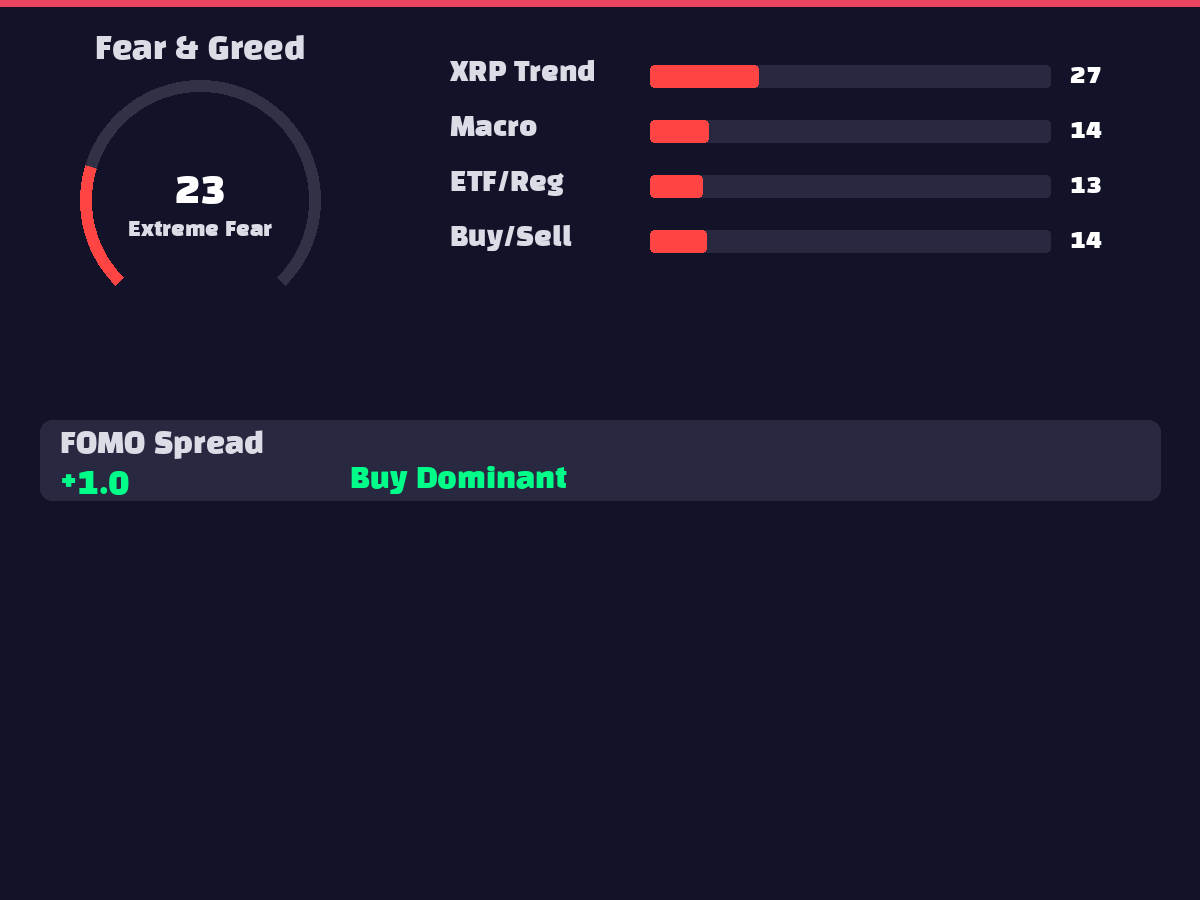
Market sentiment indicators reflect extreme fear conditions. The Fear & Greed Index of 23 indicates "extreme fear" territory, suggesting oversold conditions. XRP search trends at 27, macroeconomic trends at 15, and ETF/regulatory trends at 13 show all attention metrics at subdued levels, indicating severely contracted market participant interest. FOMO spread at 1.0 represents completely absent buying enthusiasm, while the XRP/BTC interest ratio of 0.9636 shows slightly lower relative interest compared to Bitcoin. This extreme fear state could paradoxically signal potential rebound opportunities near market bottoms.
6. 🐋 On-Chain Activity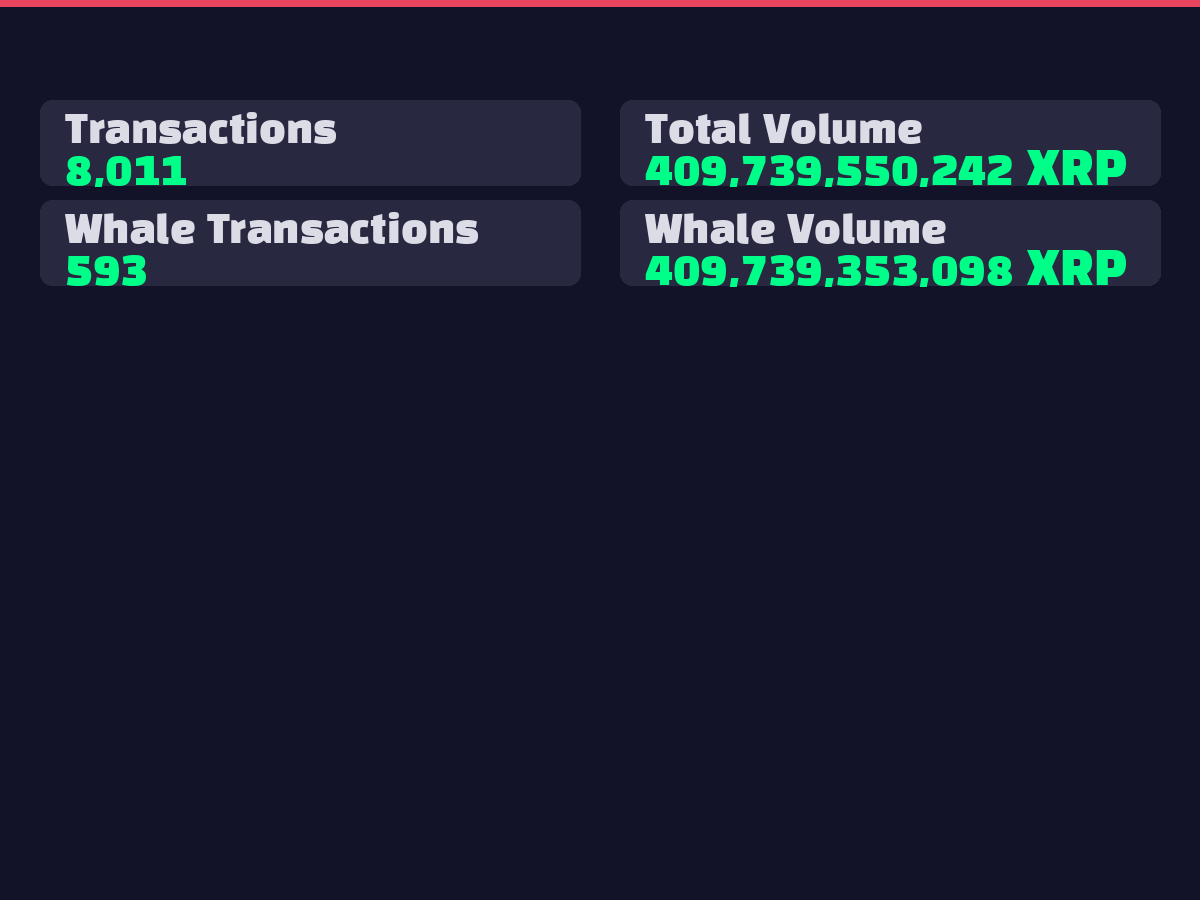
On-chain data reveals significant whale activity. Among 8,011 total transactions, 593 are classified as whale transactions, representing approximately 7.4% of transaction count. Notably, whale trading volume reaches 409,739,353,098 XRP, nearly 100% of total trading volume of 409,739,550,242 XRP. This suggests the current market is heavily influenced by large investor movements, with relatively limited retail participation. Such whale-dominated trading patterns could contribute to increased market volatility.
7. 📈 Elliott Wave / Wyckoff Analysis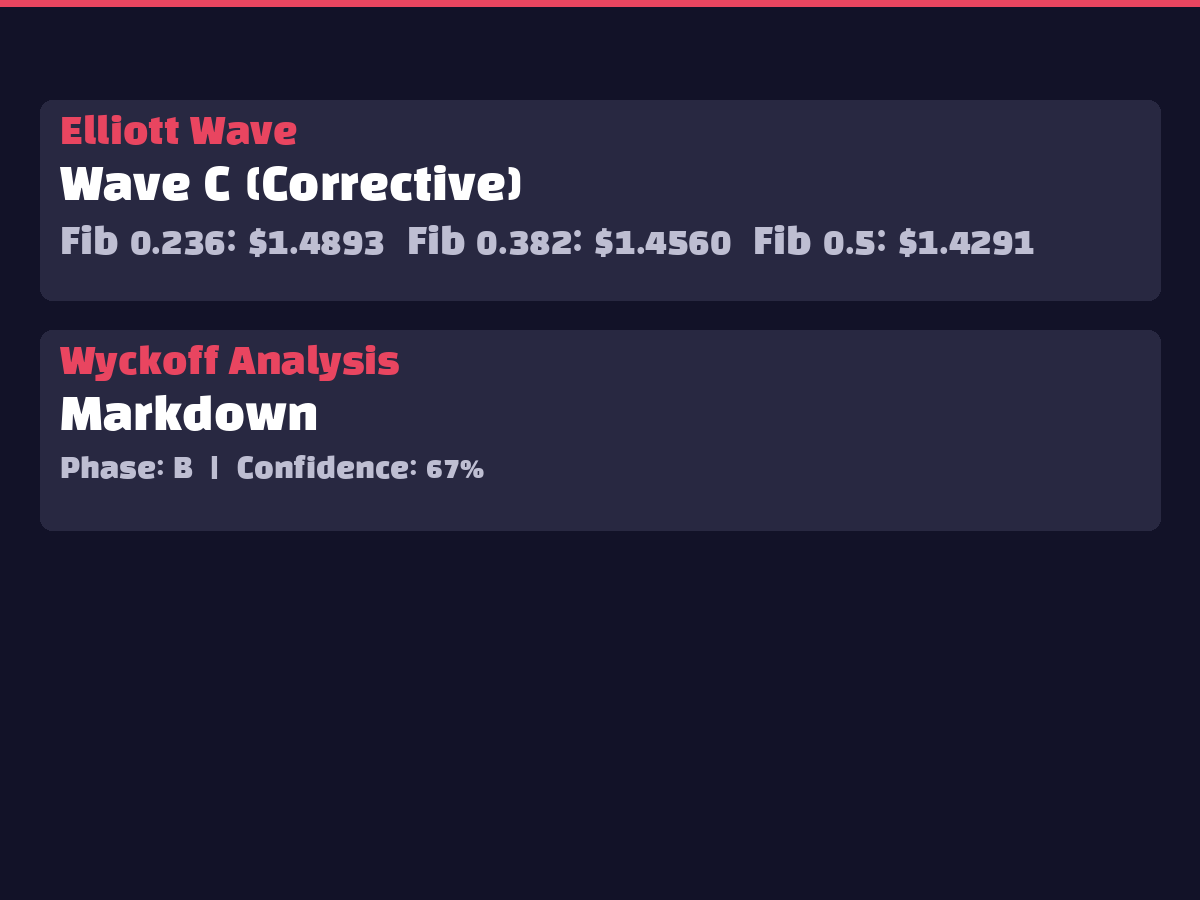
Currently, XRP is positioned in Wave C (corrective) according to Elliott Wave theory. Wyckoff analysis classifies the current stage as Phase B of the Markdown stage with 67% confidence. The Markdown stage typically involves price decline and distribution, providing theoretical basis for the current corrective trend. Phase B often shows temporary rebounds followed by renewed declines, but successful breakout from this phase could mark a transition point to a new upward cycle. The current 67% confidence level represents moderate reliability, requiring additional technical confirmation.
8. 🤖 AI Prediction Analysis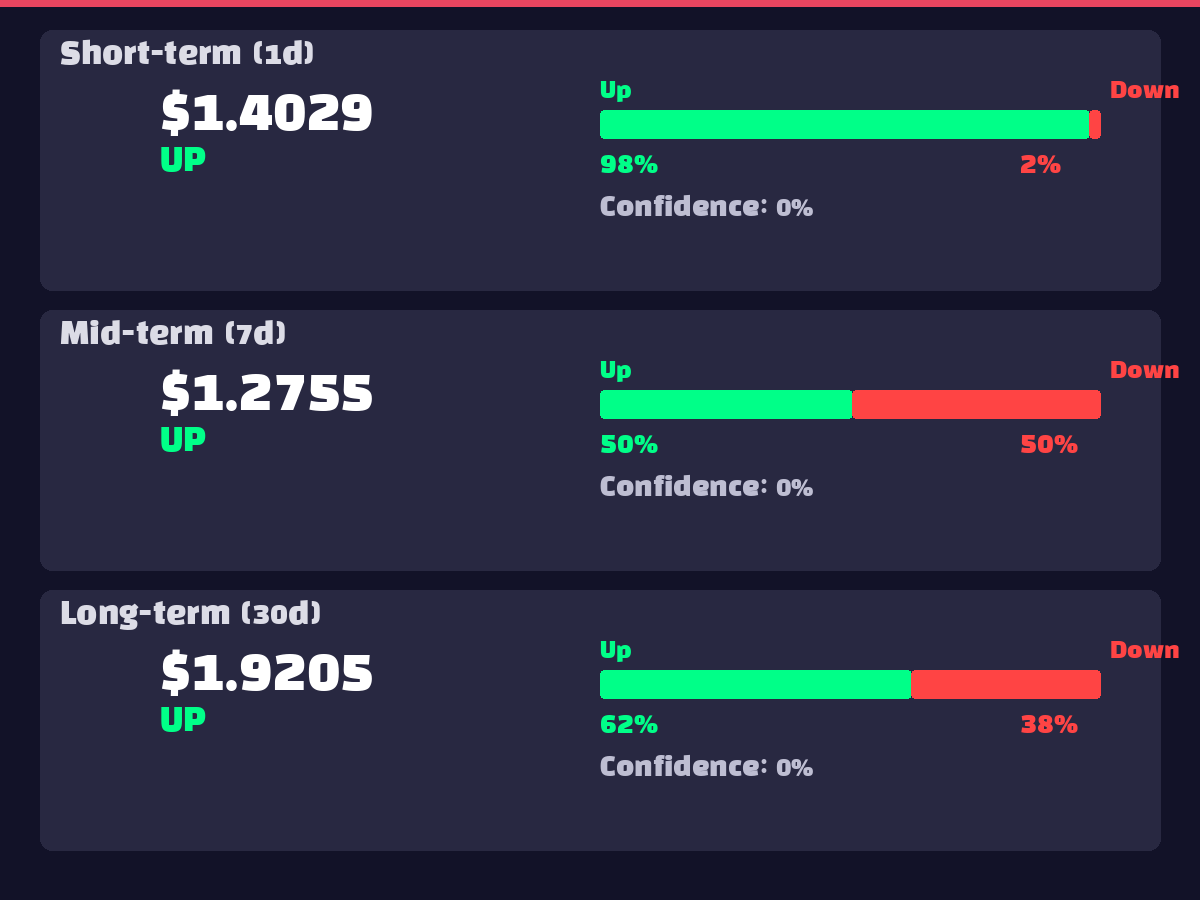
AI ensemble model predictions present varying outlooks across timeframes. Short-term (1-day) predictions target $1.4029, representing 22.2% upside with 97.8% probability, strongly suggesting technical rebound potential from current oversold conditions. Medium-term (7-day) predictions forecast $1.2755, an 11.2% gain, but probability drops to 50.5%, indicating increased uncertainty. Long-term (30-day) predictions target $1.9205, representing 67.3% substantial upside with 62.3% probability. This pattern suggests a scenario of short-term rebound, medium-term consolidation, and long-term bullish reversal.
9. ⚠️ Risk Factors
10. ✅ Overall Recommendation
Recommendation: Gradual Accumulation (Dollar-Cost Averaging Strategy)
Current XRP presents technical rebound opportunities from oversold territory, warranting gradual accumulation strategy.
Key Rationale:
Specific Entry Strategy: