1. 📌 Market Summary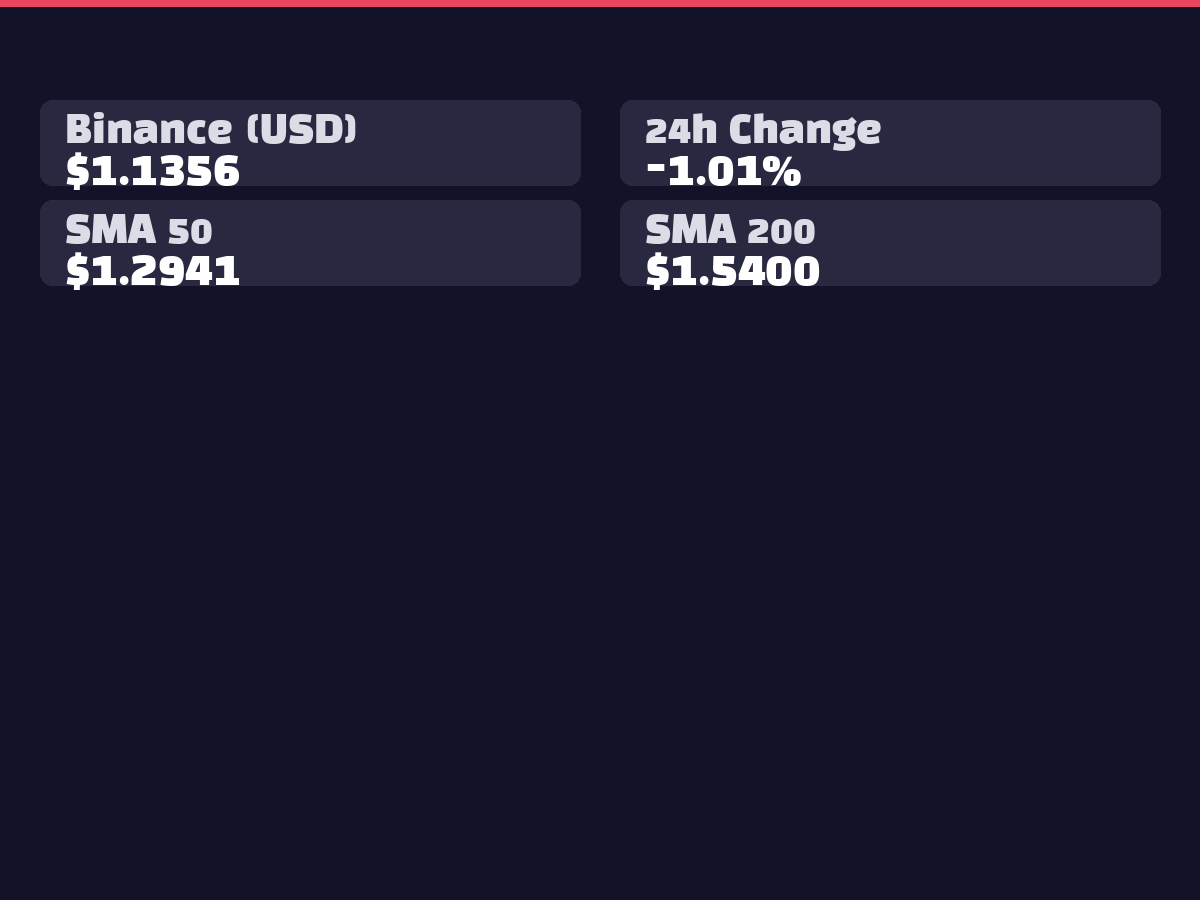
XRP is currently trading at $1.1335, recording a -1.21% decline over the past 24 hours. On the domestic Bithumb exchange, it's trading at ₩1,710 (-1.38%), reflecting USD/KRW exchange rate movements. After a 68% drop from recent highs, XRP is testing the critical support zone of $1.10-$1.30, with approximately $20.3M in net outflows observed across XRP ETFs. Short-term AI prediction models suggest a 97.6% probability of upward movement, indicating potential rebound possibilities.
2. 📊 Technical Analysis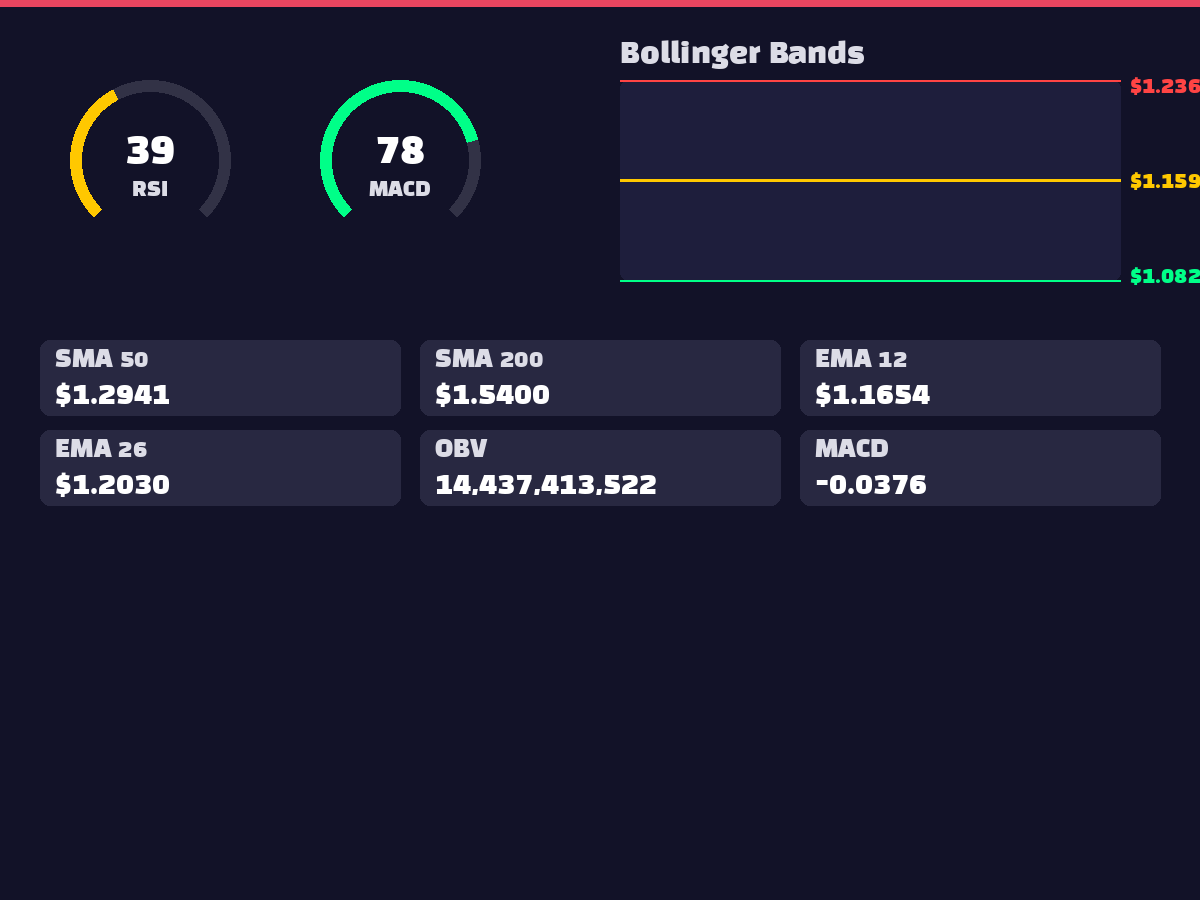
Current technical indicators suggest a short-term correction phase. The RSI(14) at 39.87 is approaching oversold territory, while MACD shows -0.0376 indicating downward momentum, though the histogram has turned positive at 0.0056, signaling potential reversal. Price is finding support near the Bollinger Band lower limit (1.0823) and currently sits below the middle line (1.1592). Deviation from key moving averages shows -12.04% from the 50-day and -26.08% from the 200-day, indicating significant correction territory. The OBV indicator at 14,437,413,522 suggests sustained volume-based buying interest.
3. 🌍 International Affairs and Macroeconomics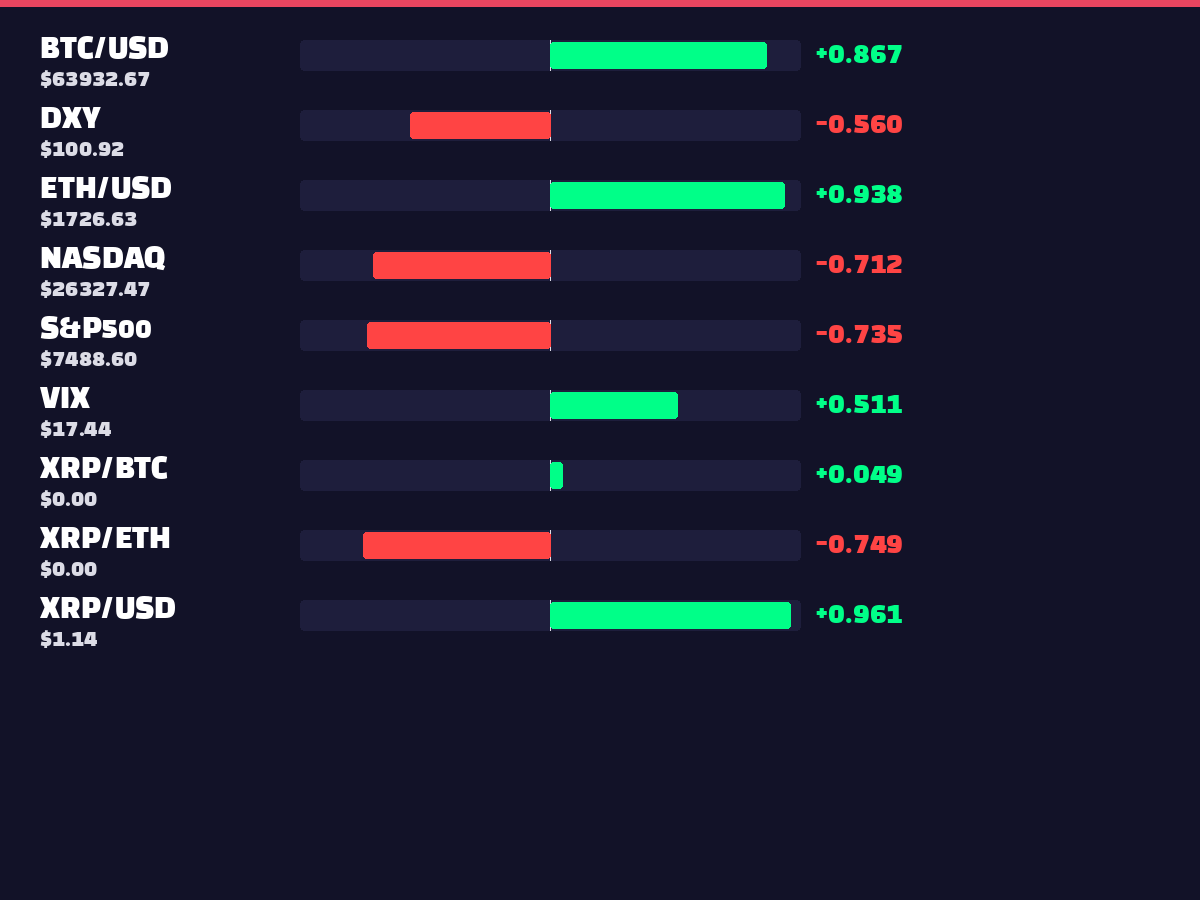
Based on collected correlation data, XRP shows inverse correlation with traditional financial markets. Strong negative correlations with S&P500 (-0.7353) and NASDAQ (-0.7117) suggest limited capital flow to cryptocurrencies during stock market rallies. The -0.5612 negative correlation with DXY indicates that dollar weakness could create favorable conditions for XRP. The 0.5311 correlation coefficient with VIX (16.98) suggests XRP volatility tends to increase alongside market volatility. Currently collected news does not show direct mentions of specific geopolitical risks or macroeconomic changes.
4. ⚖️ Regulatory and Legal Environment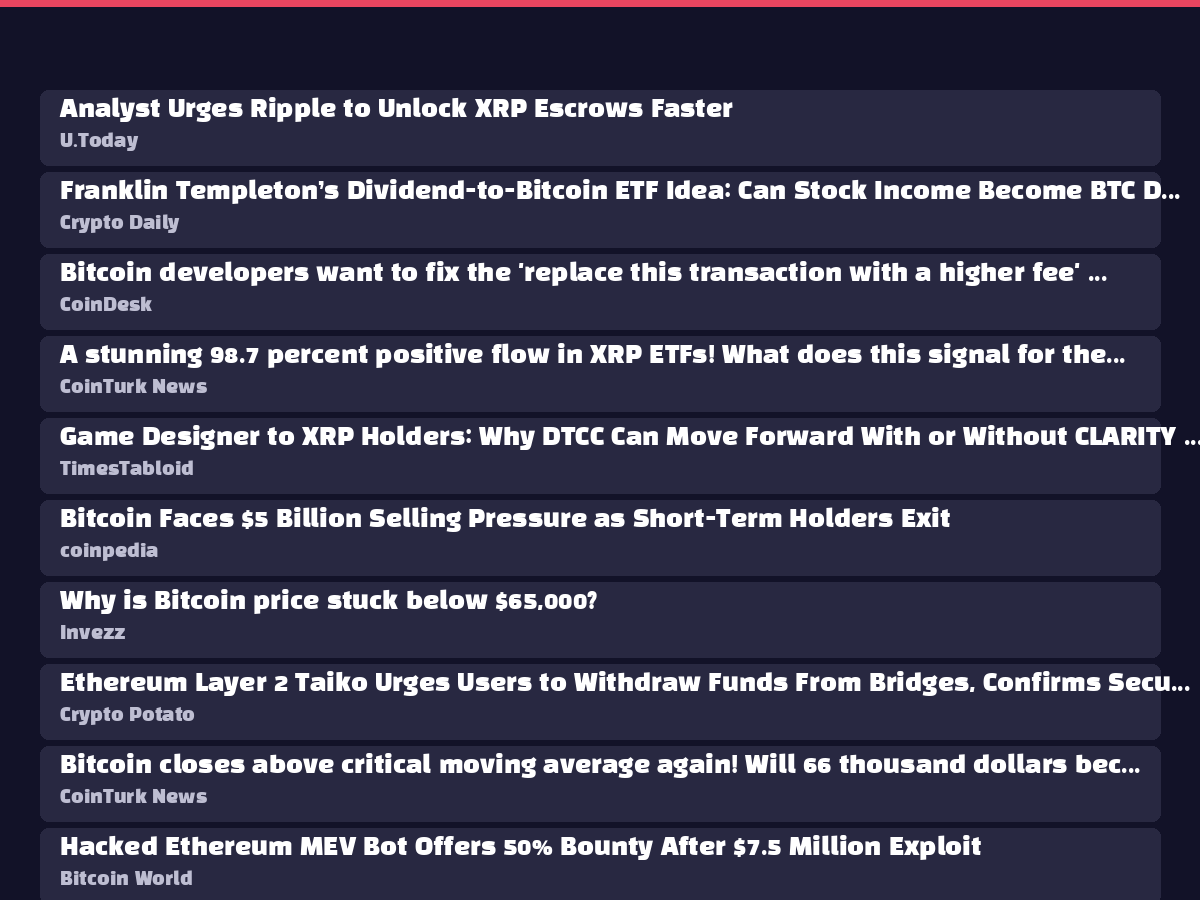
According to latest news, several important regulatory issues are in progress. July 1st has been set as a crucial deadline for Ripple's regulatory compliance in California, which could impact future business operations. Additionally, SEC-related correspondence is circulating within the XRP community, with analyst opinions suggesting that DTCC can proceed regardless of the CLARITY Act. It's confirmed that Ripple submitted an official comment letter to the FDIC regarding GENIUS Act regulations on June 9th, showing proactive regulatory engagement.
5. 😱 Market Sentiment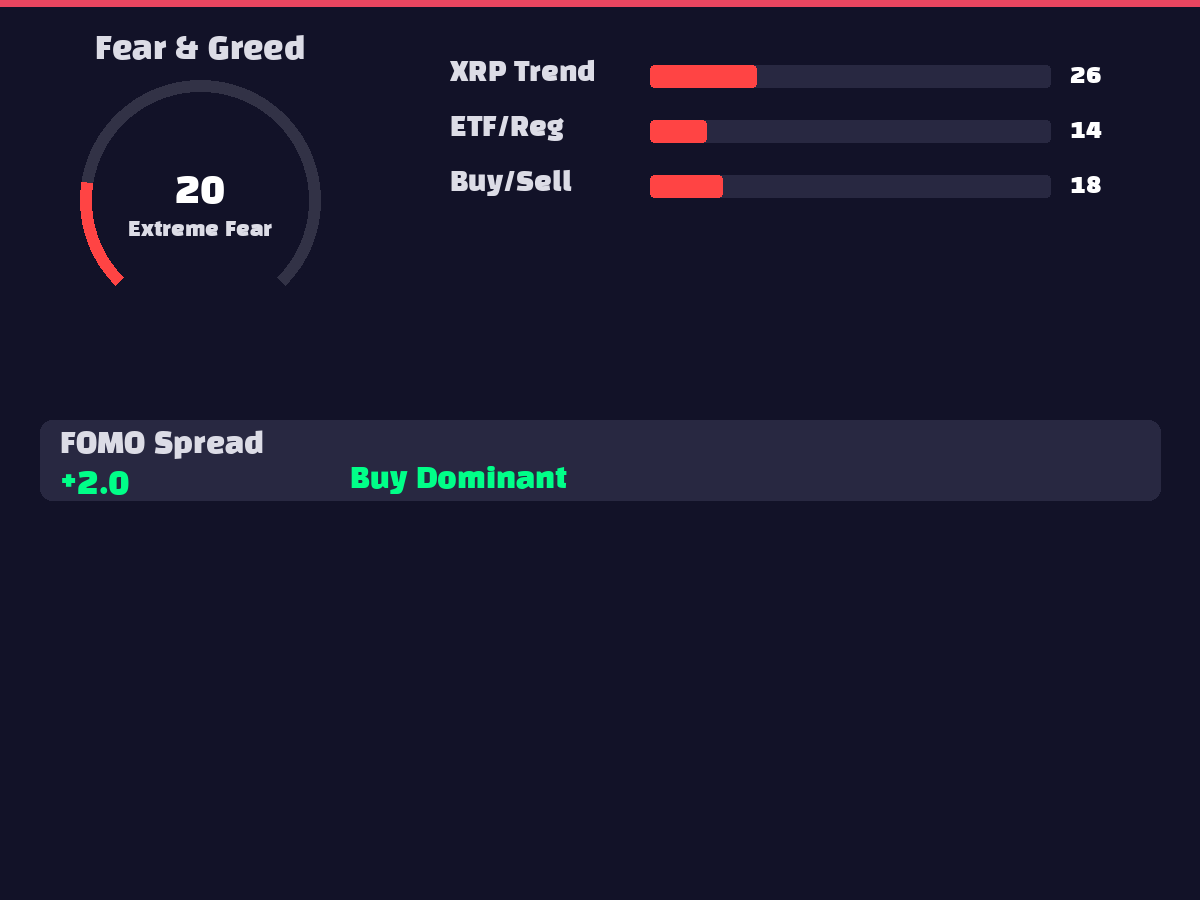
Market sentiment indicators reflect extreme fear conditions. The Fear & Greed Index stands at 20, firmly in extreme fear territory, while XRP search trends (27) and ETF/regulatory trends (14) are both recording low levels. The FOMO spread is at 2.0, indicating significantly dampened buying enthusiasm. The XRP/BTC interest ratio at 0.7857 shows relatively low interest compared to Bitcoin. This extreme fear sentiment could paradoxically signal bottom formation and suggest strong rebound potential when reversal occurs.
6. 🐋 On-Chain Activity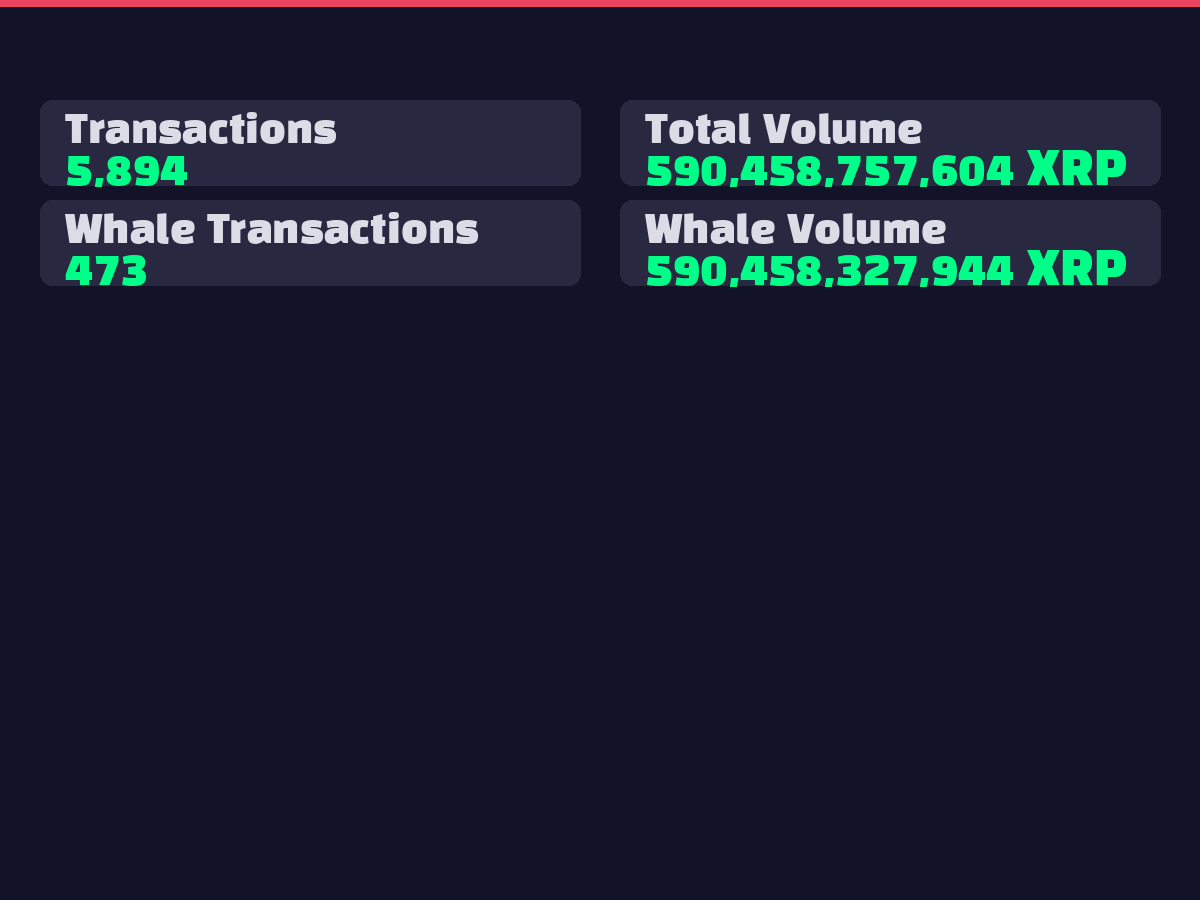
On-chain data reveals active movements from large investors. A total of 5,894 transactions occurred with an aggregate volume of 590,458,757,604 XRP. Whale transactions numbered 473, moving 590,458,327,944 XRP, representing the majority of total trading volume. This suggests institutional and large investors are actively adjusting positions at current price levels. The high proportion of whale transactions indicates significant capital deployment or redistribution by major players at these price levels.
7. 📈 Elliott Wave / Wyckoff Analysis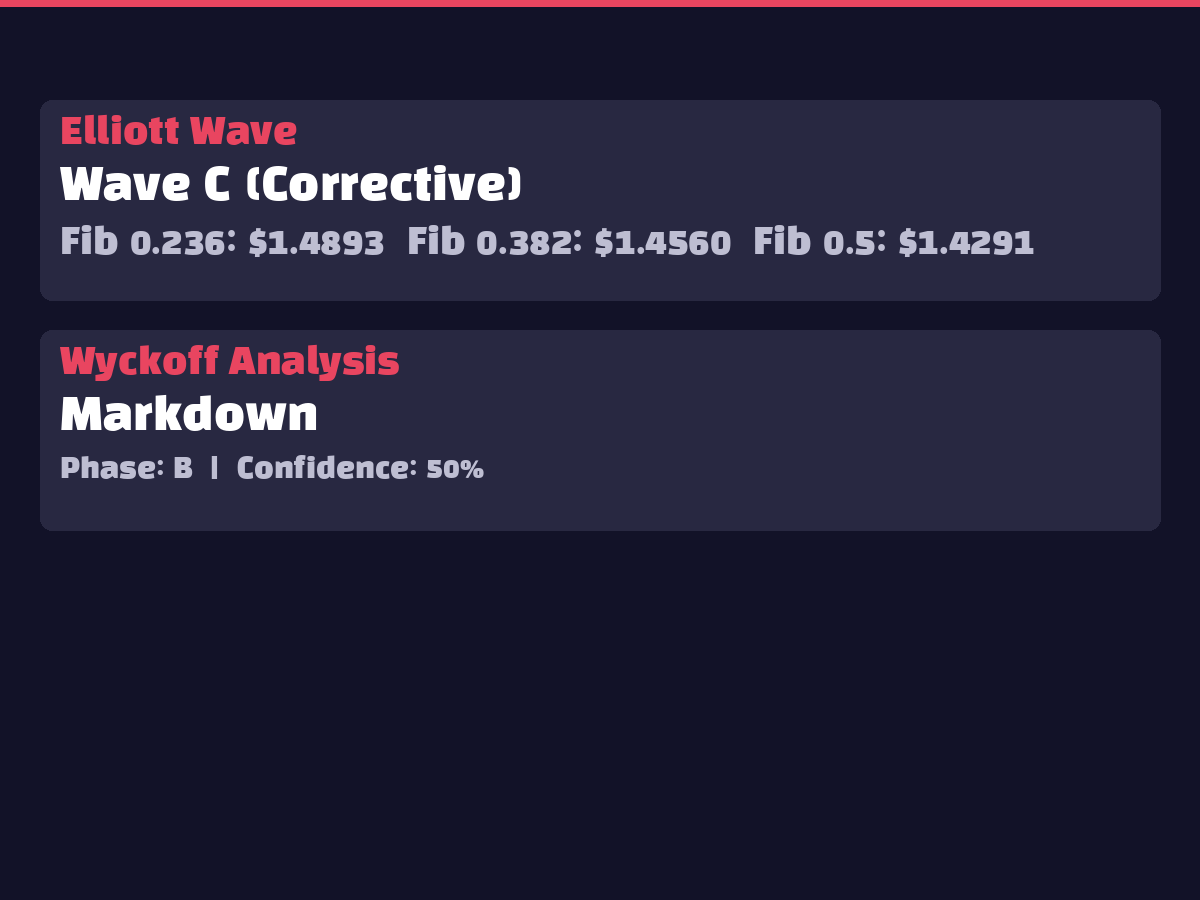
Currently, XRP appears to be in Wave C correction phase according to Elliott Wave theory. This represents the final stage of a three-wave correction pattern, potentially marking the beginning of a new upward cycle. Wyckoff analysis places it in Phase B of the Markdown stage with 50% confidence. The Markdown phase involves price decline accompanied by weak hands selling, implying potential transition to an Accumulation phase. Upon completion of current support testing, transition to a new upward phase is anticipated.
8. 🤖 AI Prediction Results Interpretation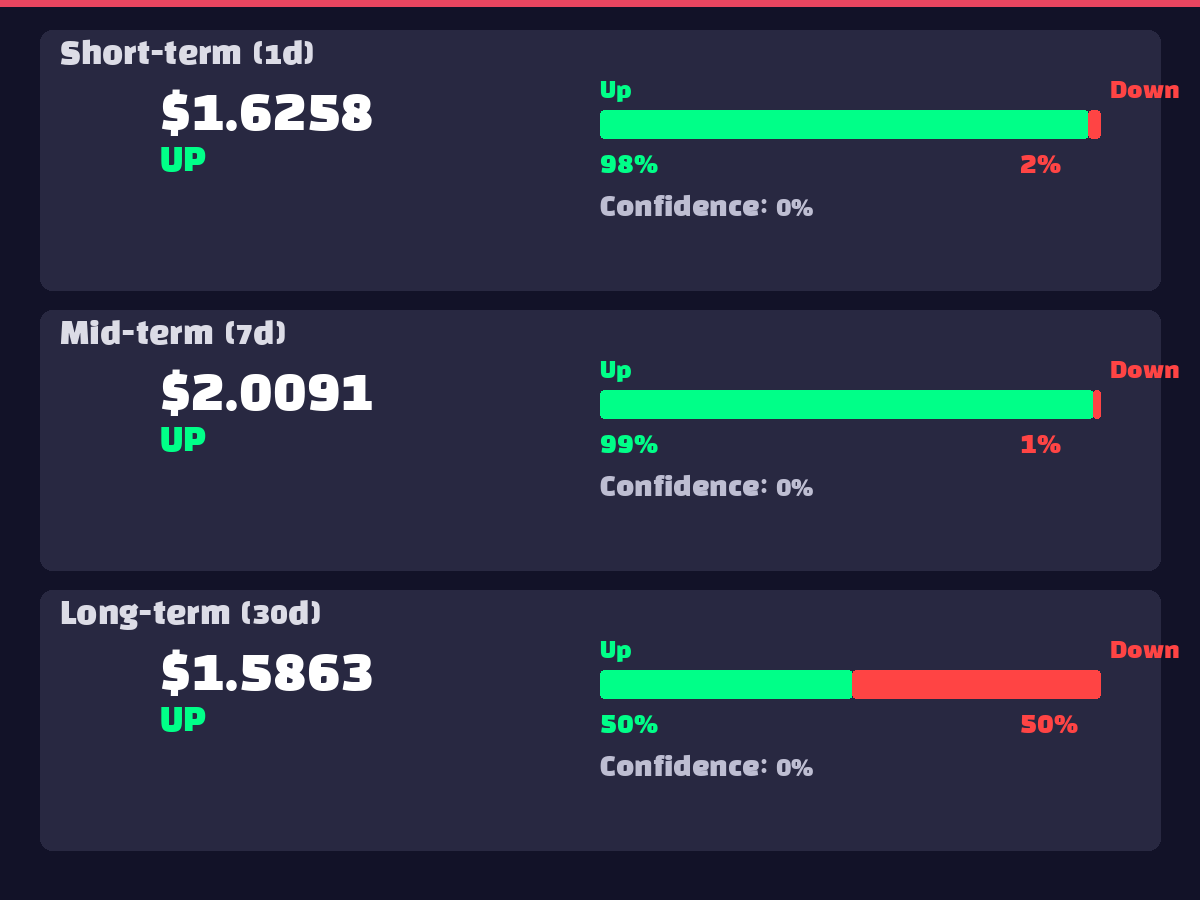
AI ensemble model predictions show varying patterns across timeframes. Short-term (1-day) predictions target $1.6258 (₩2,453) with 97.6% upward probability, suggesting 43% appreciation from current levels. Medium-term (7-day) predictions are more bullish at $2.0091 (₩3,031) with 98.6% upward probability, indicating 77% potential gains. However, long-term (30-day) predictions moderate to $1.5863 (₩2,393) with only 50.5% upward probability, showing increased uncertainty. This implies potential short-term rebound followed by re-correction, suggesting investors should consider short-term profit-taking strategies.
9. ⚠️ Risk Factors
10. ✅ Overall Assessment
Recommendation: Conditional Buy
XRP has entered an attractive entry zone based on current analysis. First, extreme fear sentiment (Fear & Greed Index 20) and oversold technical indicators (RSI 39.87) provide contrarian buying signals. Second, AI models showing 97.6% short-term upward probability with $1.6258 target suggest substantial upside potential from current levels. Third, buying within the $1.10-$1.30 core support zone offers favorable risk-reward ratios.
Specific Investment Strategy:
However, given July 1st regulatory issues and persistent ETF outflow pressure, careful attention to dollar-cost averaging and risk management is essential.