1. 📌 Market Summary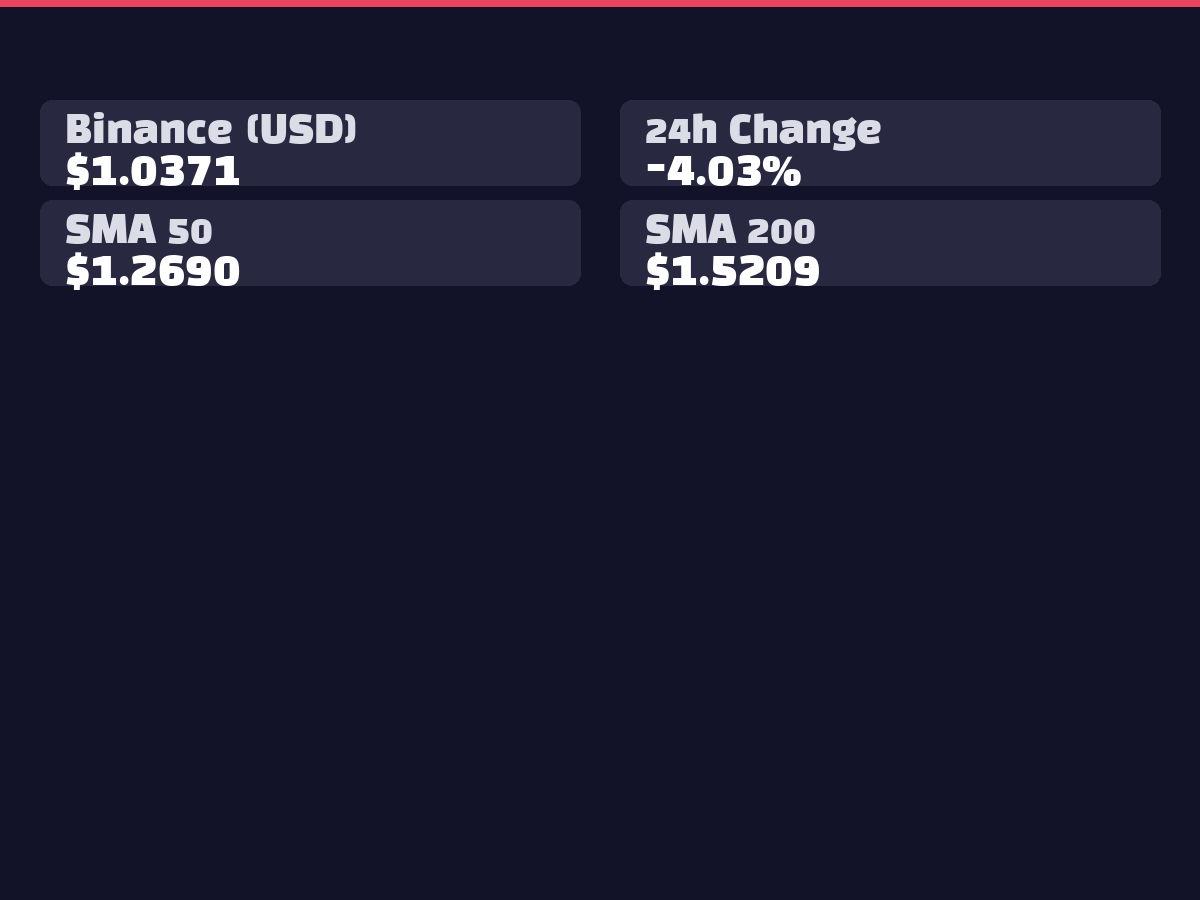
XRP is currently trading at $1.0494, down -3.33% over the past 24 hours. On Bithumb, it's trading at ₩1,588 with a similar decline of -3.35%. The 24-hour trading volume reached 156.17 million XRP, indicating active trading despite the overall cryptocurrency market correction. XRP is currently seeking support near the lower Bollinger Band at $1.0533, reflecting the broader market's adjustment phase affecting altcoin performance.
2. 📊 Technical Analysis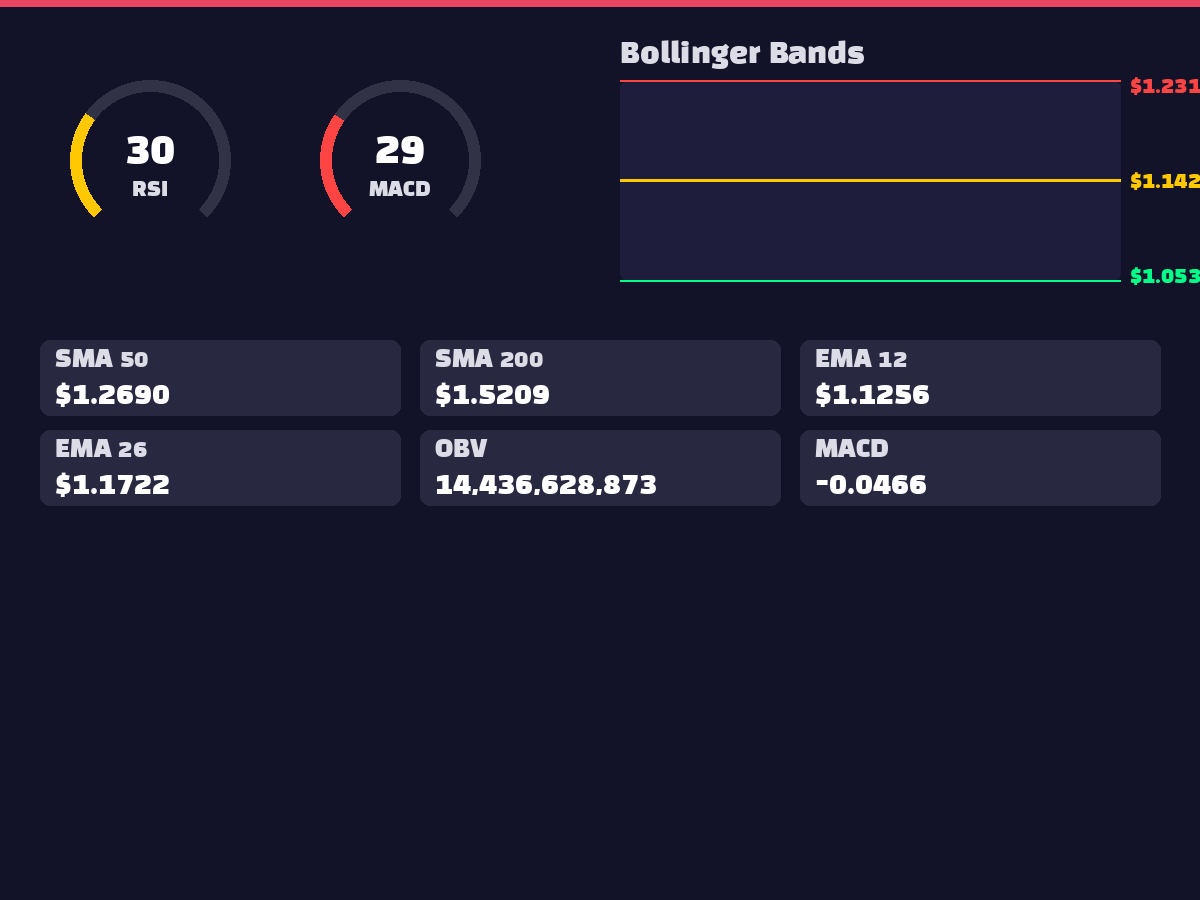
Current technical indicators suggest a short-term oversold condition. The RSI(14) at 30.10 has entered oversold territory, indicating potential for a rebound. The MACD at -0.0466 shows bearish momentum, but the histogram at -0.0040 suggests convergence. Moving average analysis reveals XRP trading below all major SMAs (20-day: $1.1423, 50-day: $1.2690, 200-day: $1.5209), confirming the overall downtrend. Price deviation shows -17.66% from the 50-day and -31.30% from the 200-day average, indicating significant correction. The OBV maintains around 14.4 billion, showing stable volume trends despite price decline.
3. 🌍 International Situation and Macroeconomics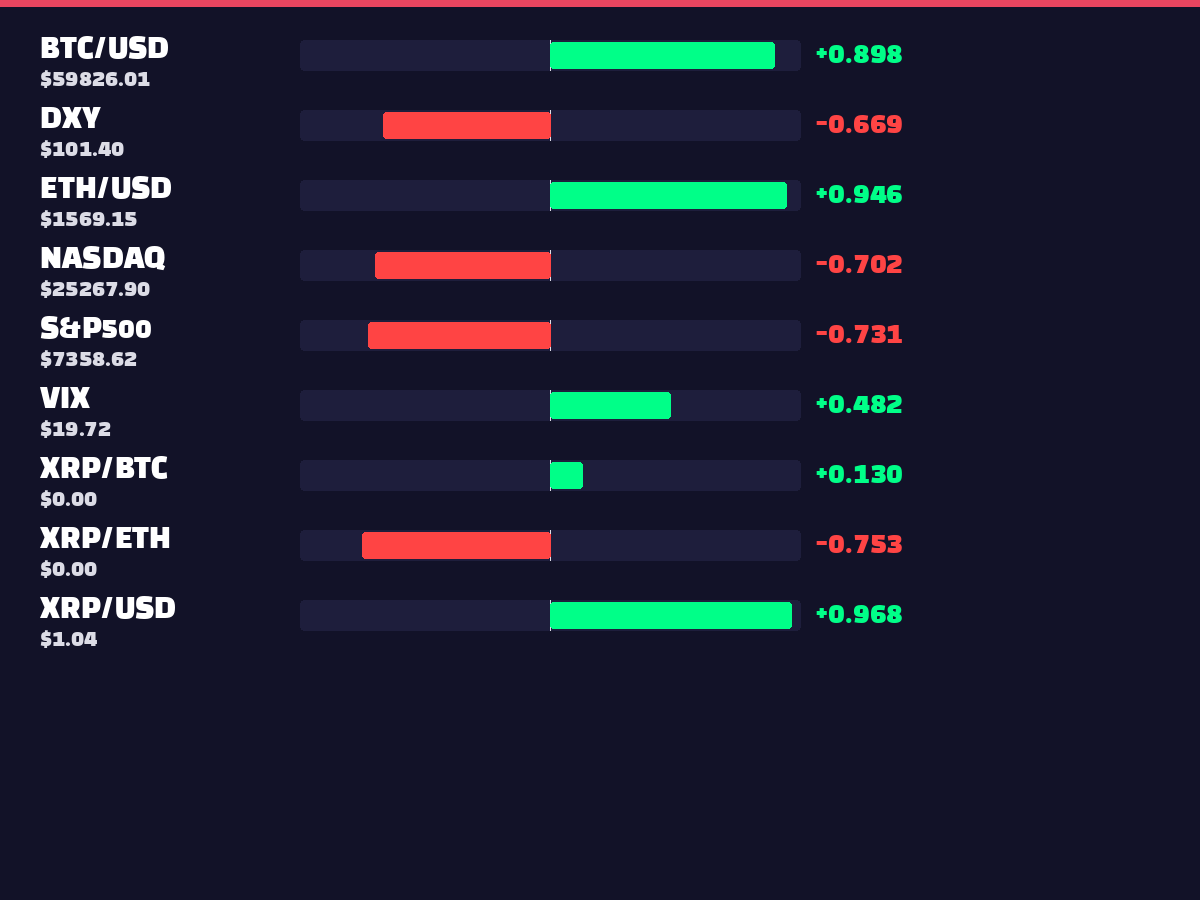
According to collected news, the broader tech stock selloff is impacting the cryptocurrency market. Inflation concerns and monetary policy uncertainty are pressuring markets globally, as confirmed by correlation asset data. The strong negative correlation with S&P500 (-0.7319) and NASDAQ (-0.7032) shows traditional financial market declines negatively impacting XRP prices. The DXY correlation of -0.6687 indicates dollar strength as a pressure factor. With VIX at 18.03 and correlation coefficient of 0.5111 with XRP, increased market volatility and risk-off sentiment are contributing to XRP's decline.
4. ⚖️ Regulatory and Legal Environment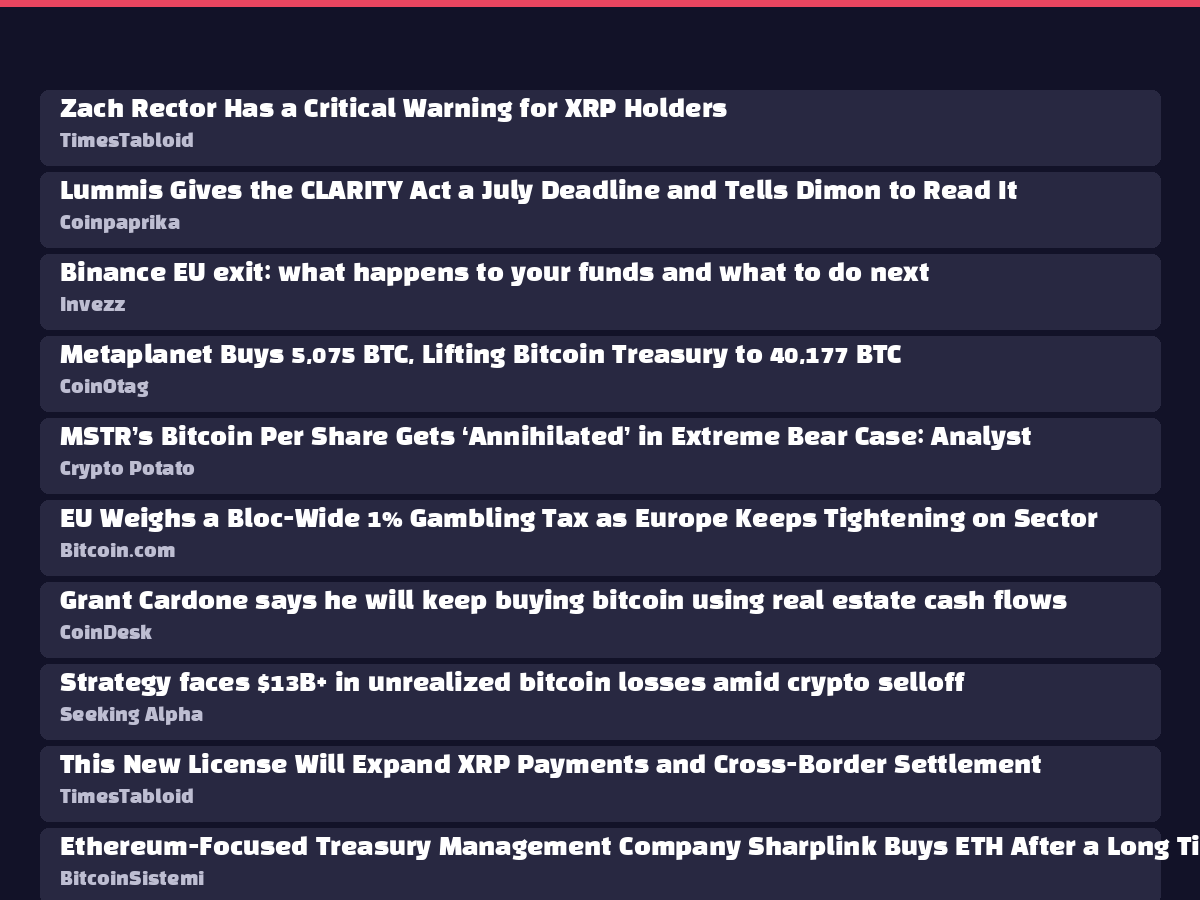
Key regulatory developments from recent news include the advancement of the US CLARITY Act in the Senate, which could provide regulatory clarity for cryptocurrencies including XRP. Additionally, Ripple has officially launched its RLUSD stablecoin in Japan with approval from the Financial Services Agency (JFSA), operating under a $6,200 transaction cap. This represents positive progress in Ripple's global regulatory approval expansion and demonstrates growing institutional acceptance in major markets.
5. 😱 Market Sentiment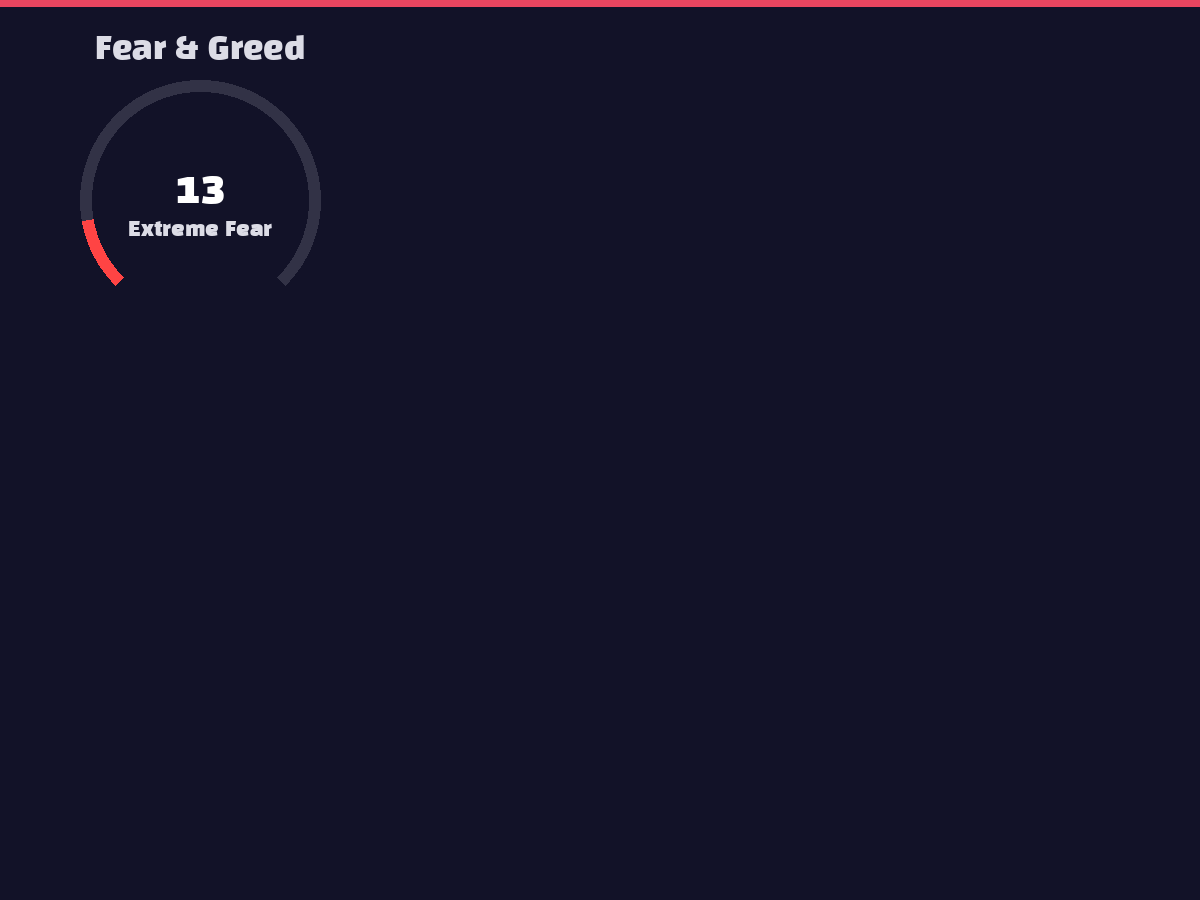
The Fear & Greed Index stands at 12, indicating extreme fear and reflecting highly negative market participant sentiment. This extreme level paradoxically could signal a market bottom formation and potential oversold bounce opportunity. Risk-aversion sentiment has strengthened across the cryptocurrency market, with particular negativity toward altcoins. However, such extreme fear levels are often associated with market bottoms, potentially presenting medium to long-term buying opportunities.
6. 🐋 On-Chain Activity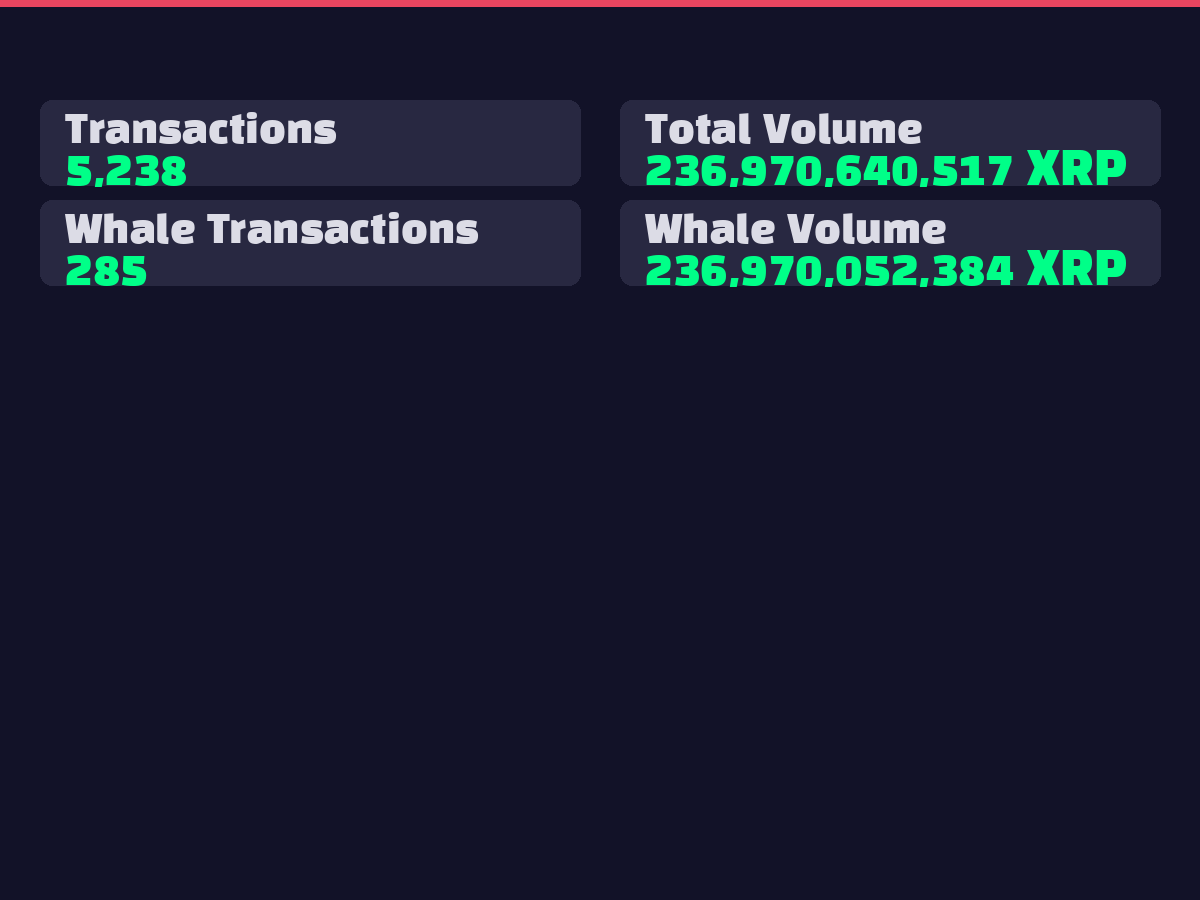
On-chain data shows 5,719 total transactions with a massive volume of 3.935 trillion XRP. Notably, whale transactions account for 484 trades representing nearly all of the total volume at 3.935 trillion XRP. This indicates active large investor movements and suggests continued institutional interest despite current price declines. Whale trading patterns will likely significantly influence future price movements and market direction.
7. 📈 Elliott Wave / Wyckoff Analysis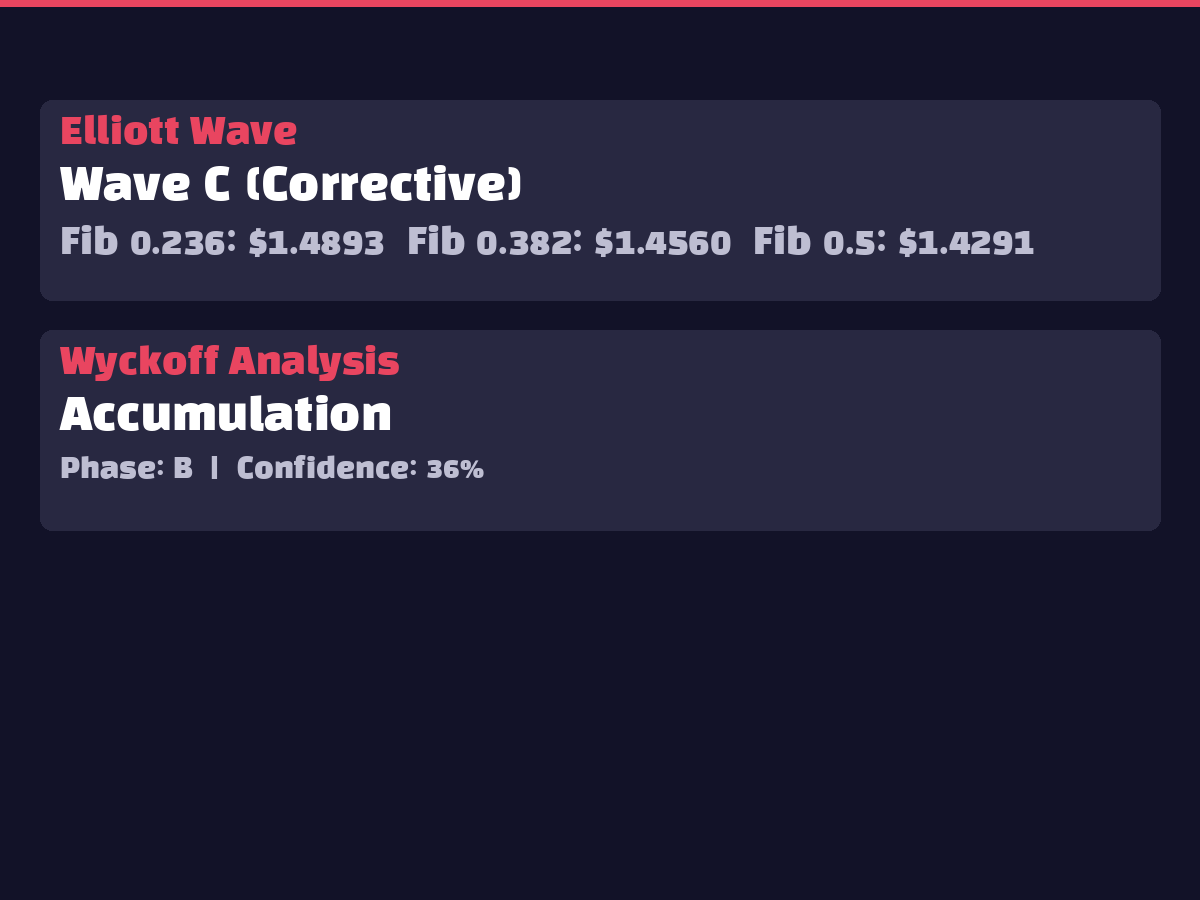
XRP is currently in Wave C (corrective phase) of Elliott Wave analysis, indicating an ongoing downward correction. Wyckoff analysis places XRP in the Accumulation phase, Stage B, though confidence level is relatively low at 36%. This suggests the market hasn't found clear direction yet, with potential for further decline before a clearer accumulation phase emerges. Completion of the C-wave correction could lead to entry into a new upward cycle.
8. 🤖 AI Prediction Results Interpretation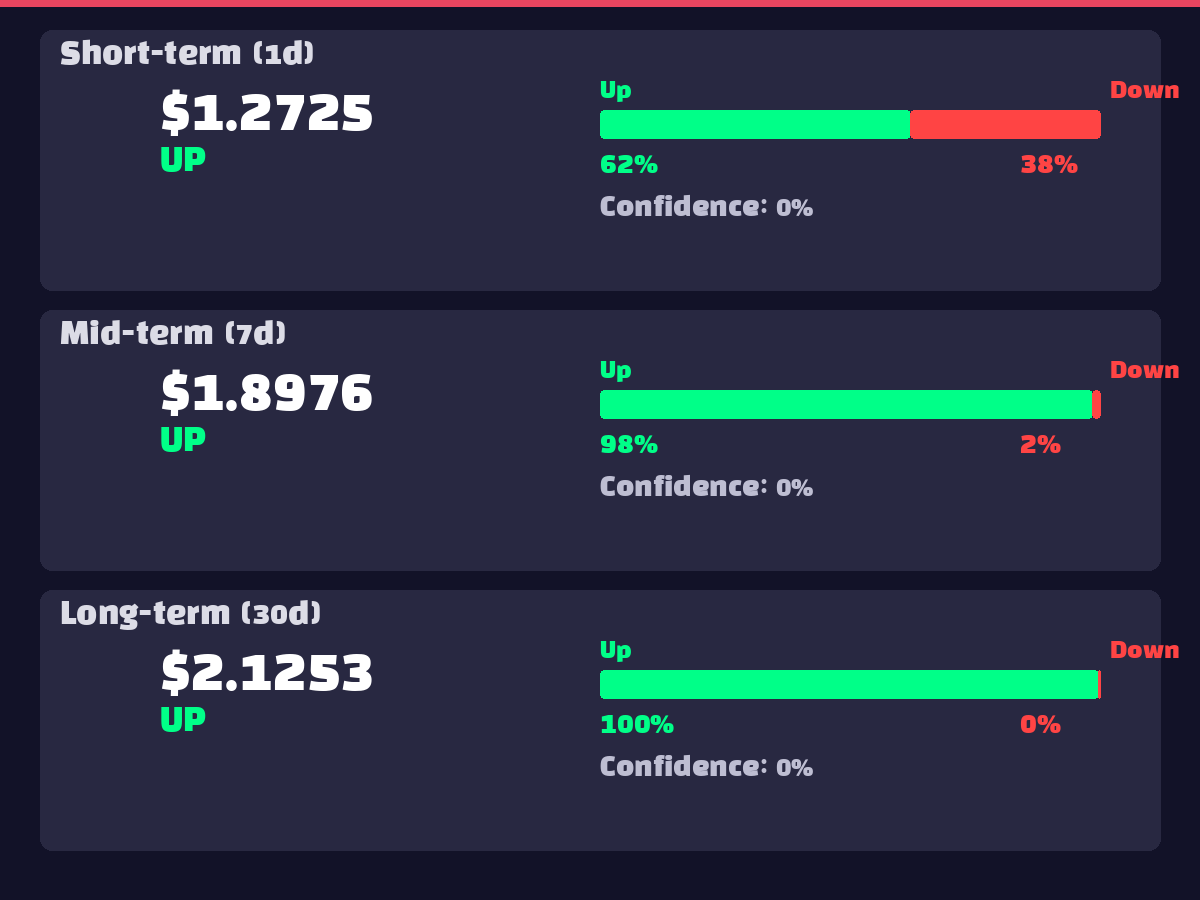
AI ensemble prediction models show intriguing results across timeframes. Short-term (1-day) prediction targets $1.2725 (₩1,926), representing 21% upside with 62% probability. Medium-term (7-day) prediction shows $1.8976 (₩2,872), indicating 80% upside with 98.5% probability. Long-term (30-day) prediction reaches $2.1253 (₩3,216), suggesting 102% upside with 99.7% probability. This pattern indicates current oversold conditions may present strong rebound opportunities, with increasing probability and targets over extended timeframes.
9. ⚠️ Risk Factors
10. ✅ Overall Opinion
Recommendation: Gradual Accumulation (Wait and Enter)
XRP presents a medium to long-term buying opportunity due to extreme oversold conditions and high probability of bottom formation.
Key Supporting Factors:
Specific Strategy:
While extreme fear conditions paradoxically present buying opportunities, a dollar-cost averaging strategy is recommended considering macroeconomic uncertainties.