XRP Market Analysis Report
Analysis Time: July 4, 2026 16:14 (KST) / 2026-07-04 07:14 (UTC)
1. 📌 Market Summary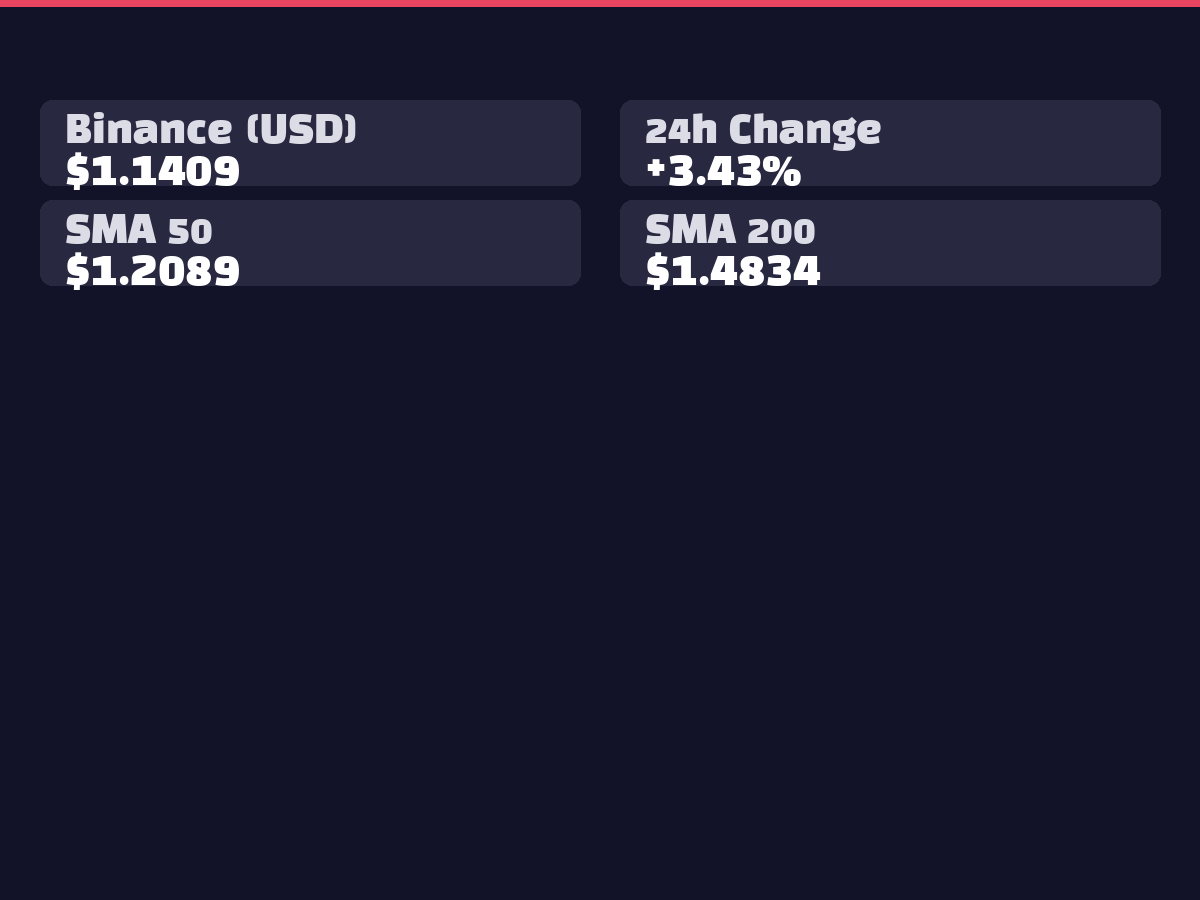
XRP is currently trading at $1.1358 on Binance with a +3.44% gain over 24 hours, showing positive momentum. The Bithumb KRW price stands at ₩1,716 with a 3.75% increase, demonstrating similar upward movement aligned with the global market. With 24-hour trading volume reaching 91.04 million XRP, active trading continues, however, the price remains below key moving averages (50-day, 200-day), making medium to long-term trend recovery a critical factor to watch.
2. 📊 Technical Analysis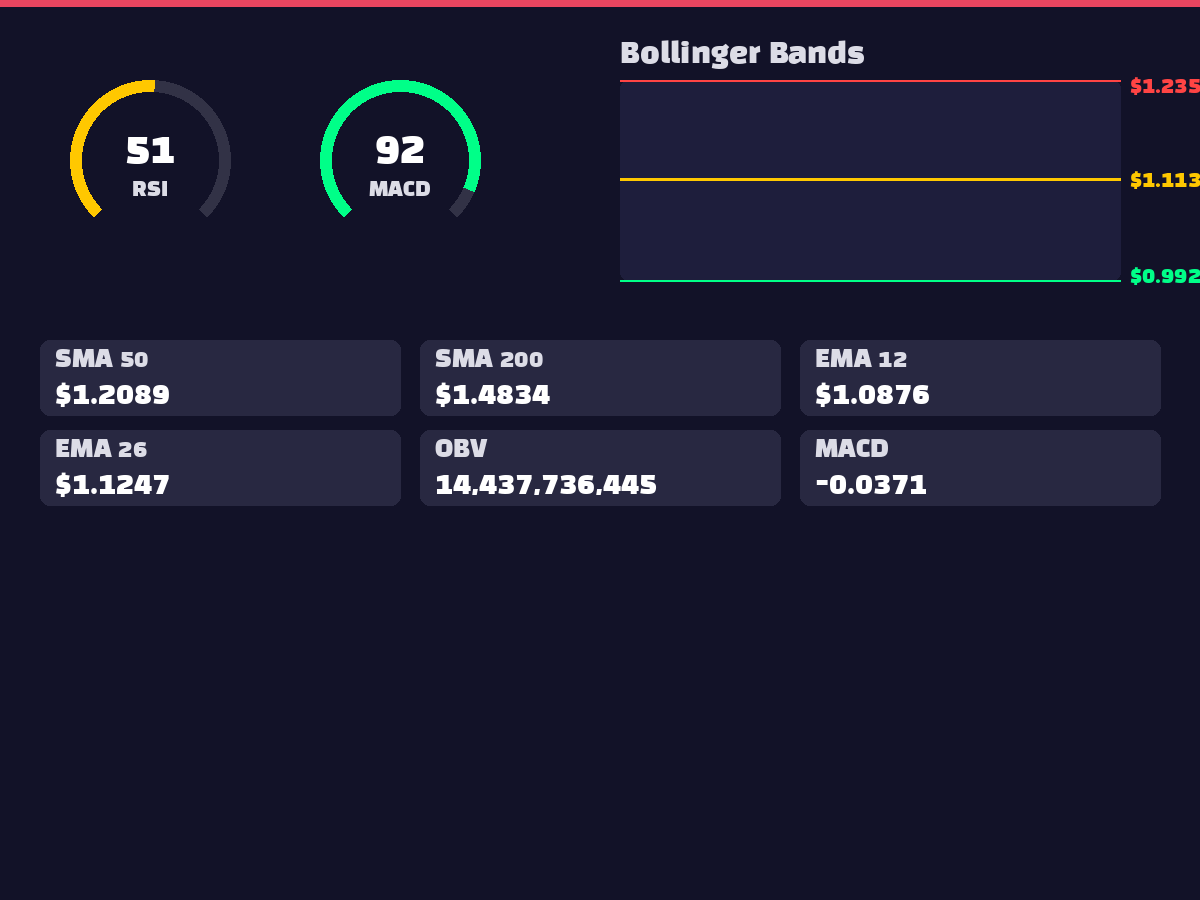
The RSI(14) at 51.26 sits in neutral territory with slight upward bias, suggesting additional upside potential without being in overbought/oversold zones. MACD(-0.0371) remains in negative territory, but the histogram (0.0084) has turned positive, indicating emerging short-term bullish momentum. Within the Bollinger Bands, the current price ($1.1358) is moving from the middle line (1.1139) toward the upper band (1.2352), suggesting upward pressure. Distance analysis shows the price is -6.11% below the 50-day MA, -12.56% below the 100-day MA, and -23.49% below the 200-day MA, indicating that further upside is needed for medium to long-term trend reversal.
3. 🌍 International Affairs and Macroeconomic Environment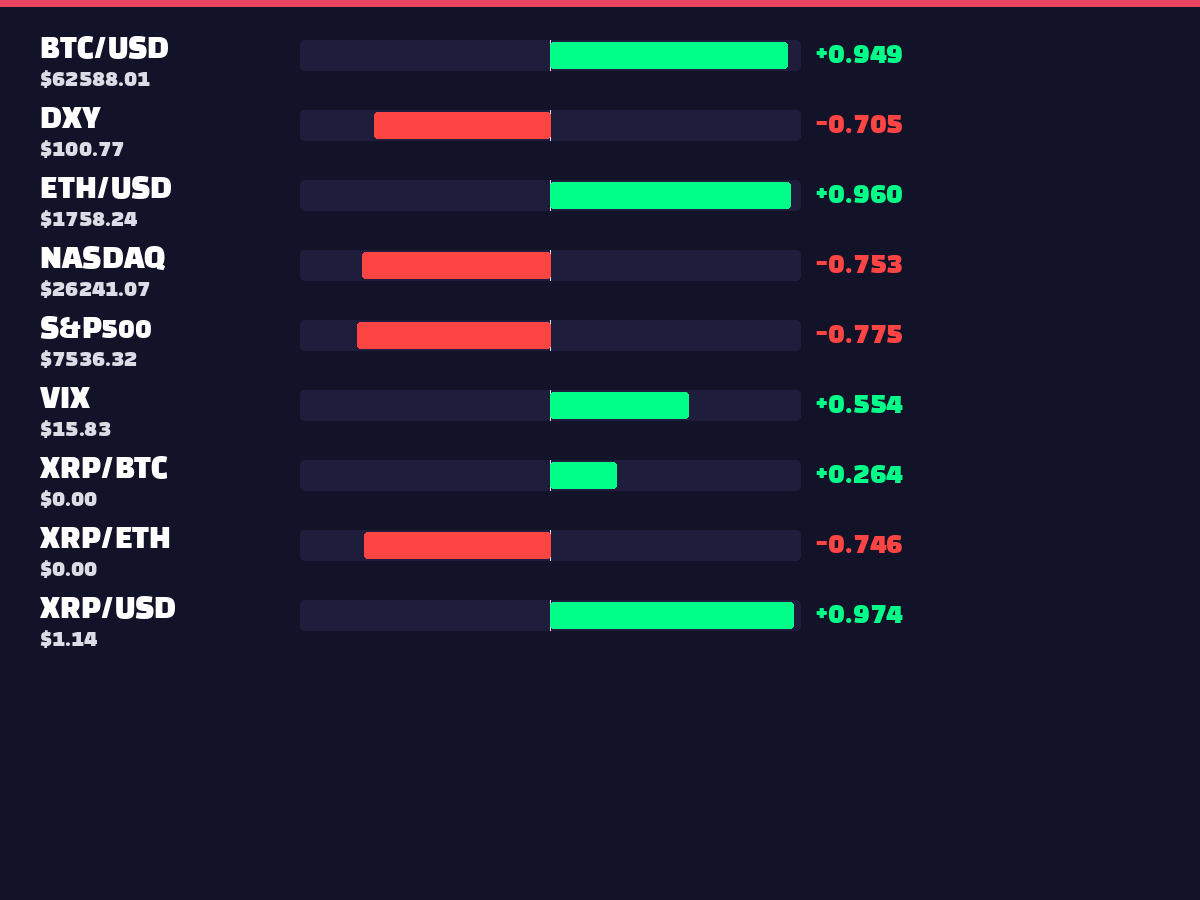
No significant international developments were identified in the collected news data. However, correlation asset data reveals important macroeconomic insights. The strong negative correlation coefficient of -0.7046 between DXY (Dollar Index) at 100.77 and XRP suggests higher probability of XRP gains during dollar weakness. Strong negative correlations with S&P500 (-0.7749) and NASDAQ (-0.7532) indicate potential capital flow into cryptocurrencies during traditional market corrections. The VIX correlation coefficient of 0.5543 suggests XRP may experience increased volatility alongside market uncertainty.
4. ⚖️ Regulatory and Legal Environment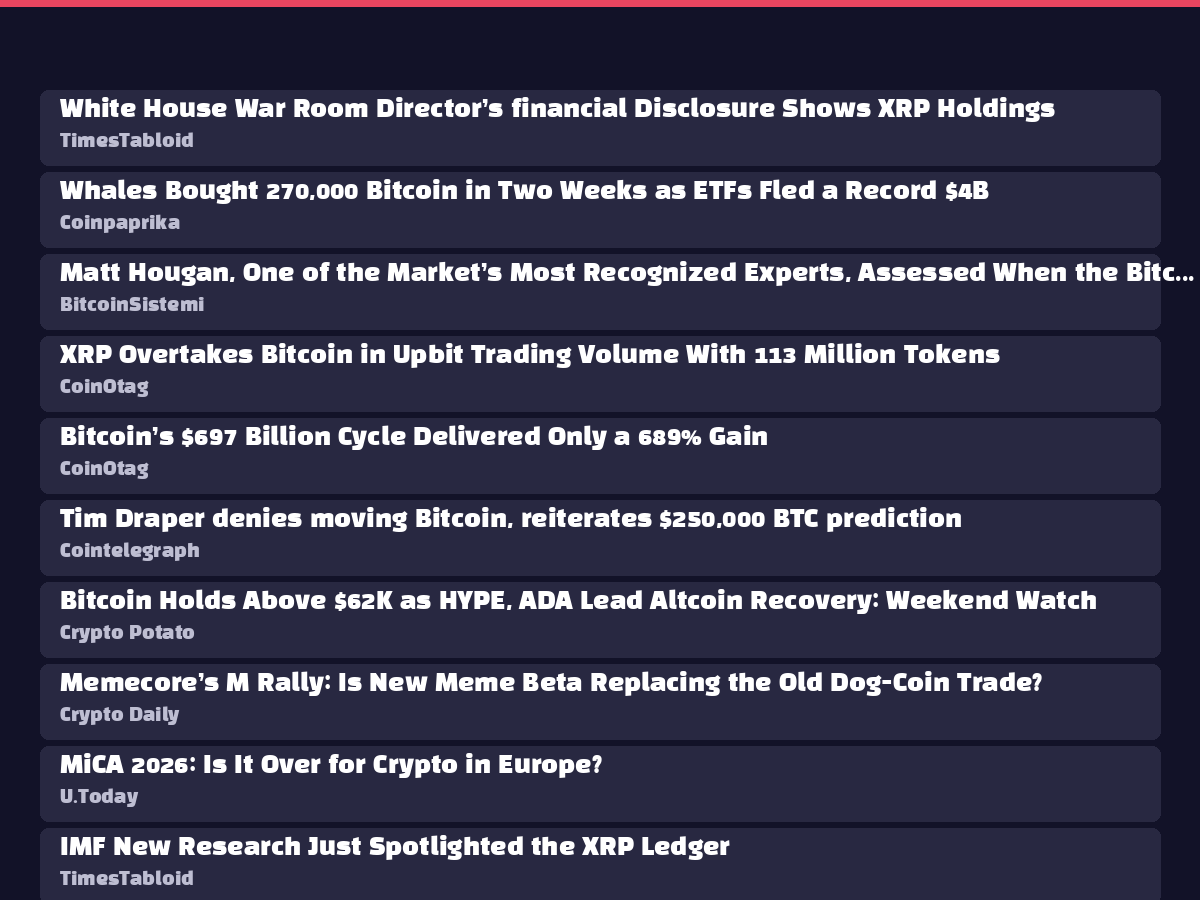
No major regulatory developments were confirmed in the currently collected news data. However, XRP ETF data shows negative net inflows across all products (XRPT, XRPI, XXRP, XRPR, XRPZ, XRP) ranging from -$0.1M to -$7.5M, indicating short-term institutional caution or some selling pressure among institutional investors.
5. 😱 Market Sentiment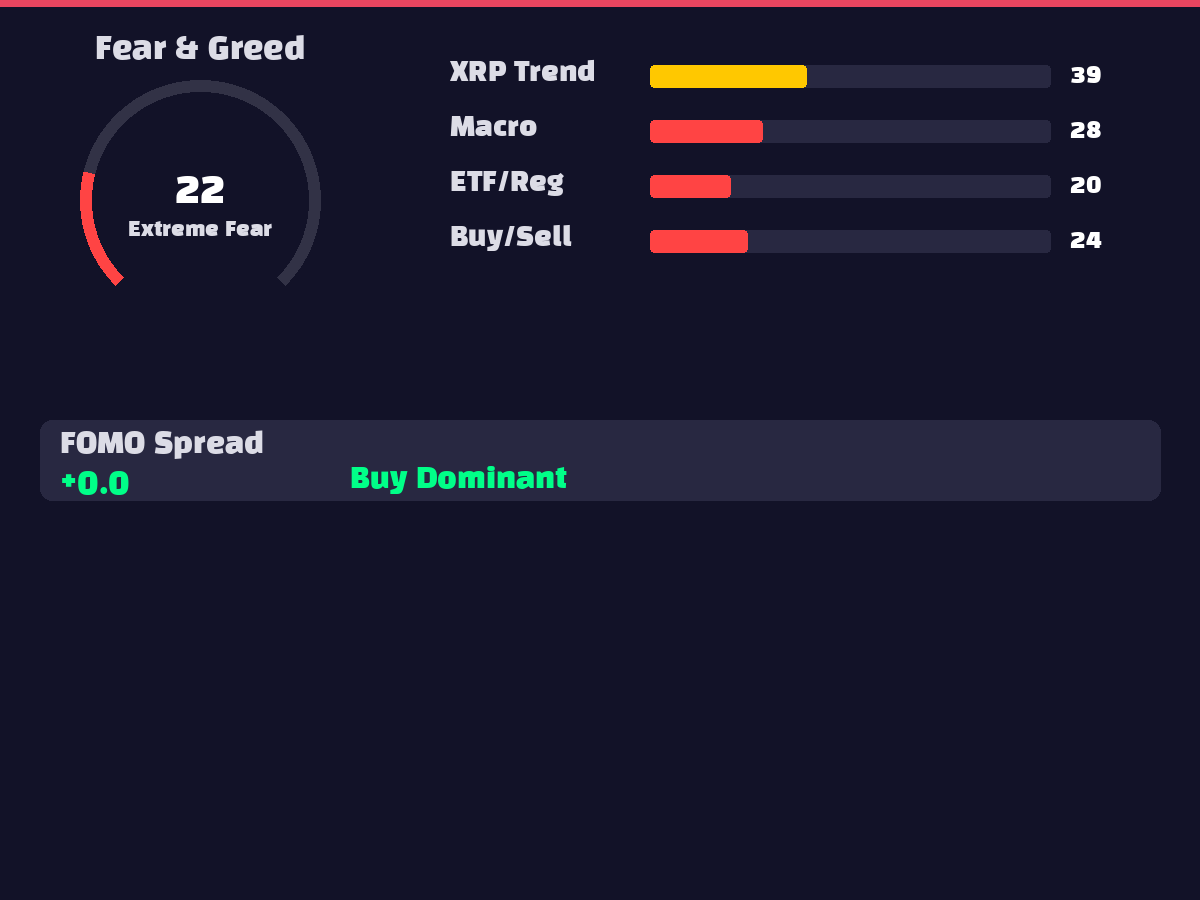
The Fear & Greed Index at 21 indicates "Extreme Fear," showing highly conservative attitudes among market participants. This typically serves as a contrarian bottom signal and could paradoxically present buying opportunities. The total -$20.5M net outflow from XRP ETFs reflects short-term bearish sentiment, but such extreme fear often precedes market reversals. The high correlation coefficient (0.9490) with Bitcoin demonstrates XRP's significant sensitivity to overall cryptocurrency market sentiment.
6. 🐋 On-Chain Activity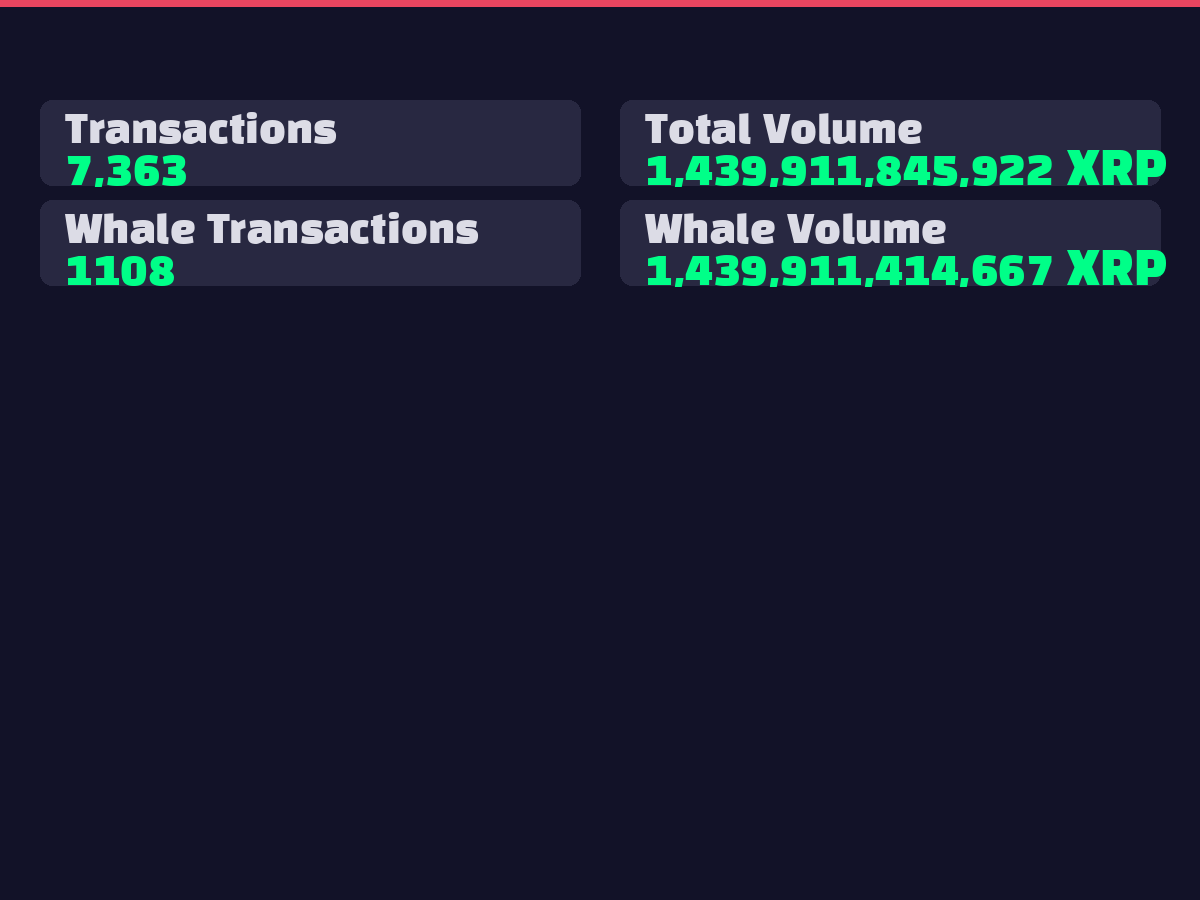
Whale trading activity is highly active with 1,384 large transactions totaling 983,506,999,092 XRP, indicating significant institutional and large investor position adjustments. With whale transactions representing a substantial portion of the total 8,482 transactions, major players are actively repositioning. The total transaction volume of 983 trillion XRP exceeds normal levels, representing a typical pattern during significant price movement periods. While increased whale activity may amplify short-term volatility, it typically represents a process toward establishing new equilibrium levels in the medium to long term.
7. 📈 Elliott Wave / Wyckoff Analysis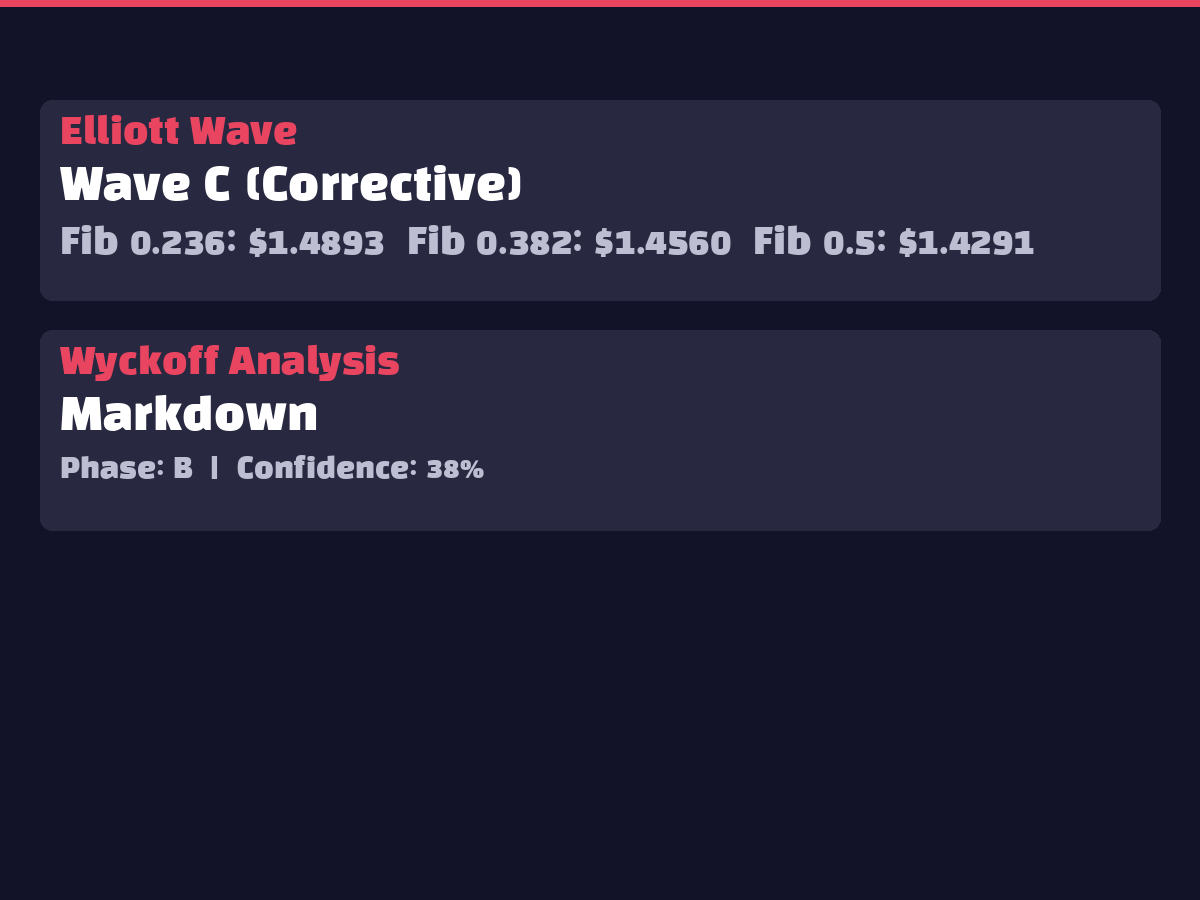
Current Elliott Wave analysis places XRP in Wave C (corrective), indicating an ongoing downward correction phase. Wyckoff analysis shows the market in the Markdown phase, specifically stage B, with 38% confidence level, which is relatively low. This suggests the market is in a decline (Markdown) process following distribution, but clear directional bias hasn't been established yet. Upon completion of Wave C correction, a new upward cycle (Wave 1) is likely to begin, positioning the current range near a critical turning point.
8. 🤖 AI Prediction Results Interpretation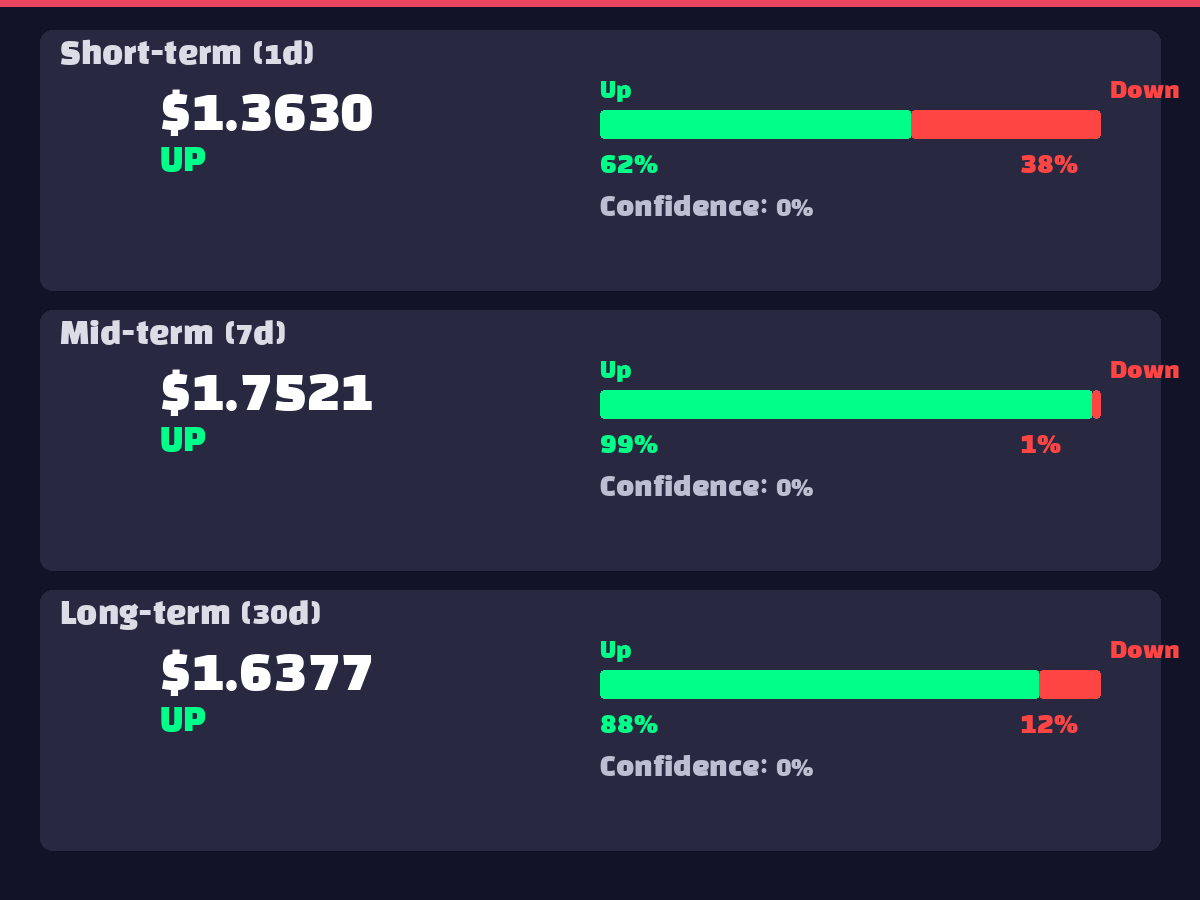
AI ensemble model predictions are highly optimistic. Short-term (1-day) prediction of $1.3630 (62.4% upward probability) anticipates approximately 20% gains from current levels, while medium-term (7-day) forecasts $1.7521 (98.5% upward probability), projecting substantial 54% gains. The 98.5% probability for the 7-day prediction demonstrates very high confidence. Long-term (30-day) prediction of $1.6377 (87.8% upward probability) shows slight moderation from medium-term but still expects 44% gains, overall presenting a strong bullish scenario. These predictions contrast sharply with current fear sentiment, suggesting the market's excessive pessimism is being reflected in the analysis.
9. ⚠️ Risk Factors
10. ✅ Overall Opinion
Recommendation: Gradual Accumulation (Cautious Buy)
XRP currently displays classic bottom signals with extreme fear sentiment coinciding with technical correction, presenting a medium to long-term buying opportunity.
Key Supporting Arguments:
Specific Strategy:
We recommend a staged approach: initial 40% position in current range, additional 30% upon $1.05 breakthrough, and remaining 30% on $0.95 touch.