1. 📌 Market Summary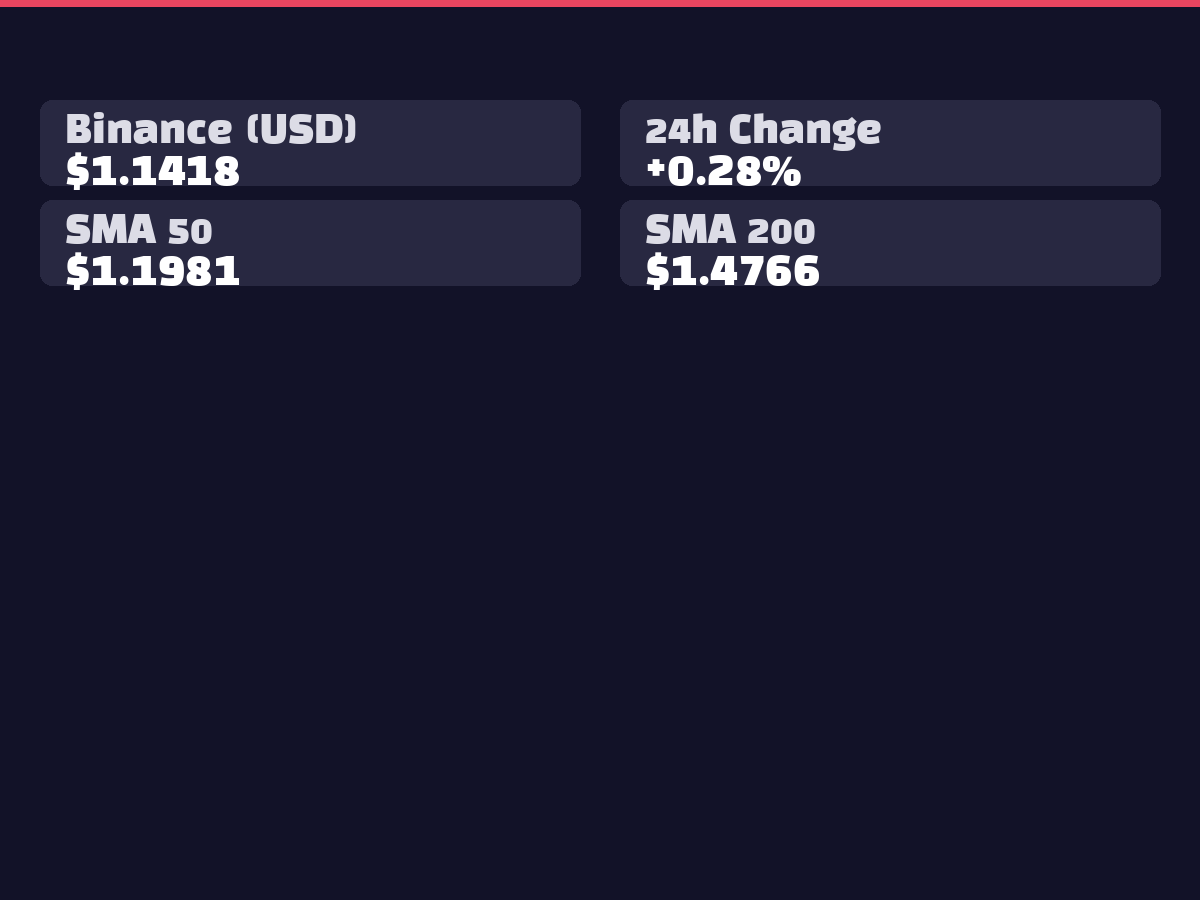
XRP is currently trading at $1.1387 on Binance, recording a modest 24-hour gain of +0.09%. The Bithumb KRW price stands at ₩1,717 with a -0.06% decline, reflecting USD/KRW exchange rate fluctuations. The 24-hour trading volume of 50,925,782 XRP indicates moderate liquidity. The RSI at 54.80 in neutral territory and MACD's bullish divergence signal suggest potential short-term technical recovery opportunities.
2. 📊 Technical Analysis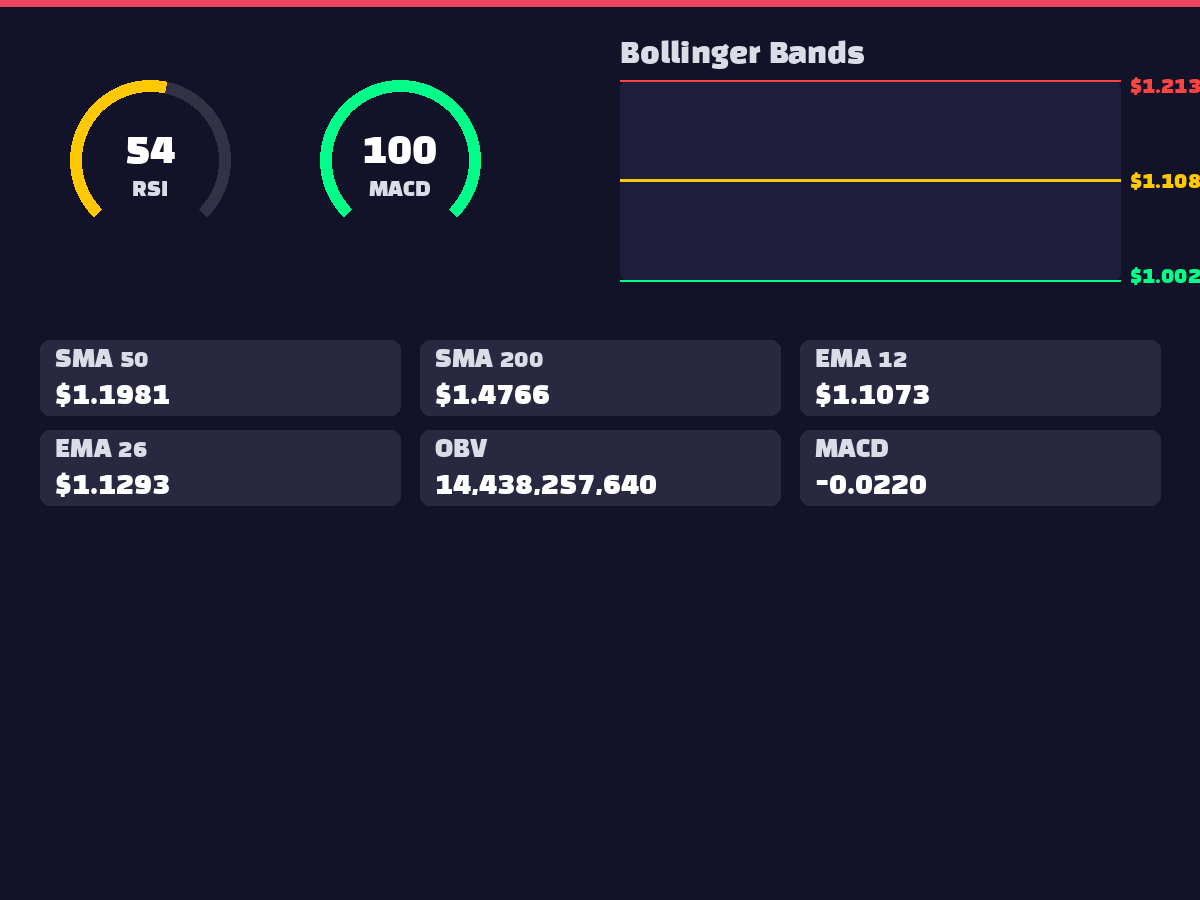
XRP's technical indicators present mixed signals. The RSI(14) at 54.80 remains in neutral territory, indicating neither overbought nor oversold conditions. MACD at -0.0220 shows a positive histogram of 0.0162, suggesting emerging bullish momentum. Within the Bollinger Bands, the current price sits near the middle line (1.1084) with upside potential to the upper band (1.2139). Moving average analysis reveals negative divergence across all timeframes: 50-day (-3.38%), 100-day (-10.57%), and 200-day (-21.60%), reflecting persistent medium-to-long-term bearish trends. The OBV at 14,438,257,640 indicates volume-based buying pressure.
3. 🌍 International Geopolitics and Macroeconomics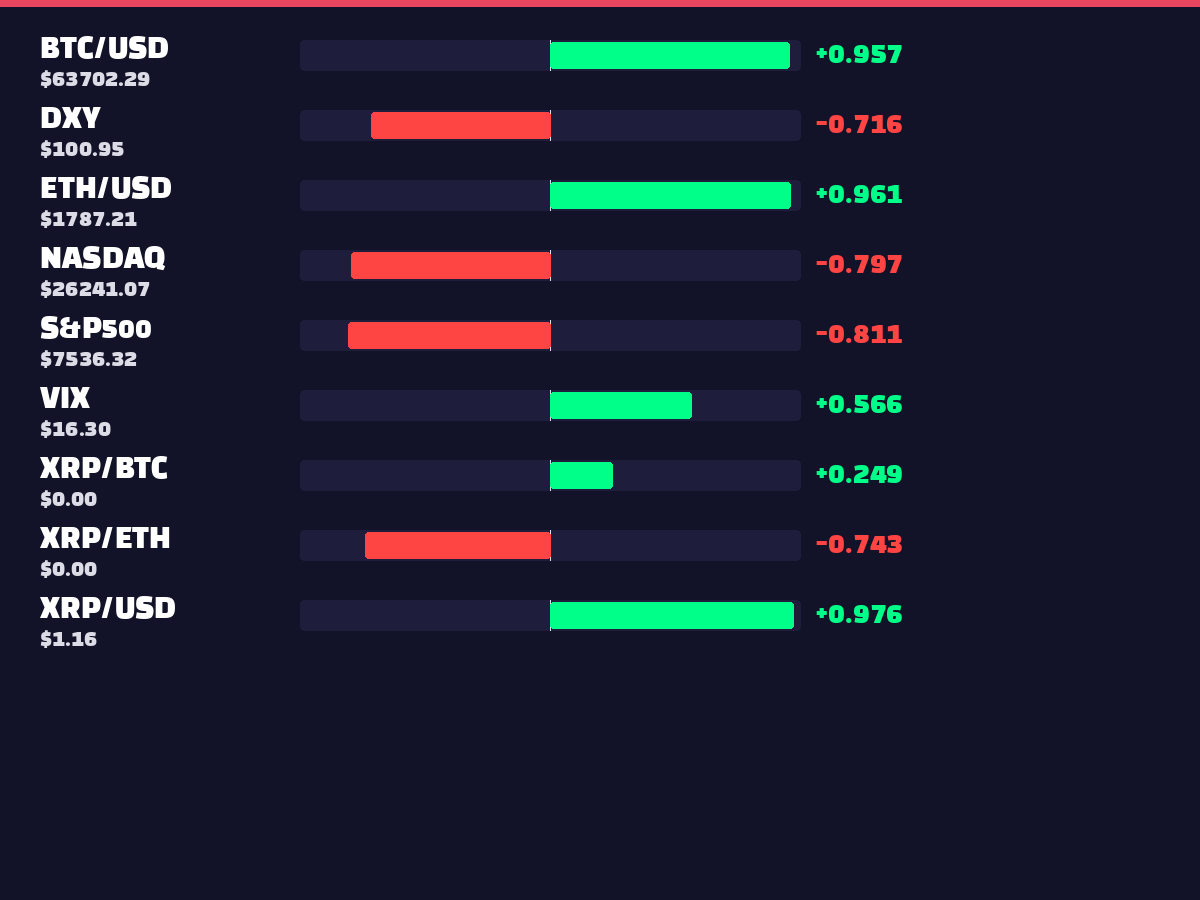
No significant geopolitical developments were identified in the collected news data. Correlation analysis reveals negative relationships with DXY (-0.7165), S&P500 (-0.8109), and NASDAQ (-0.7966), indicating XRP tends to strengthen during dollar weakness. The correlation coefficient of 0.5739 with VIX (15.83) suggests XRP volatility increases alongside market uncertainty. Strong positive correlations with BTC (0.9568) and ETH (0.9610) demonstrate crypto market synchronization.
4. ⚖️ Regulatory and Legal Environment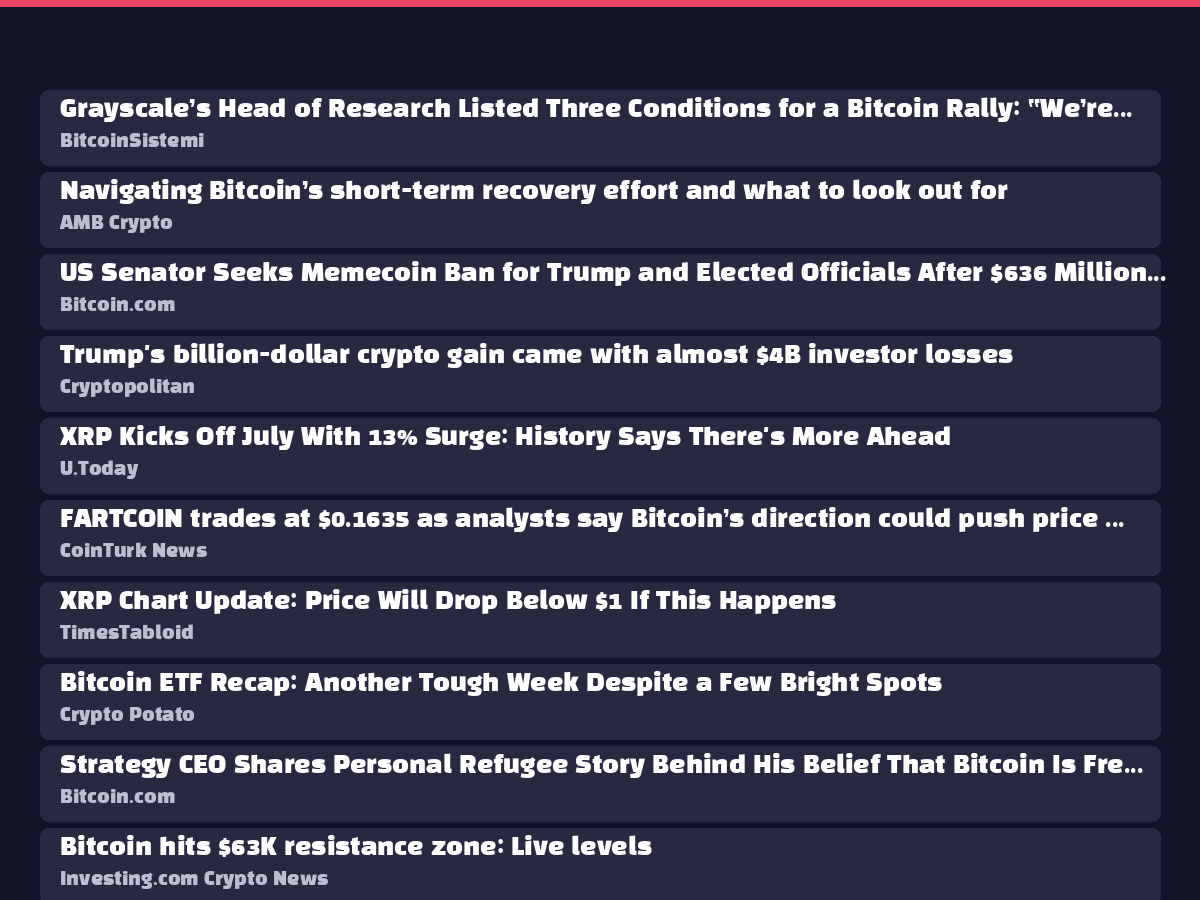
No major regulatory changes were identified in the current news collection. XRP ETF data shows net outflows across all products: XRPT, XRPI, XXRP, XRPR, XRPZ, and XRP, totaling approximately $20.5M in institutional selling pressure. This reflects short-term institutional bearishness despite ETF availability.
5. 😱 Market Sentiment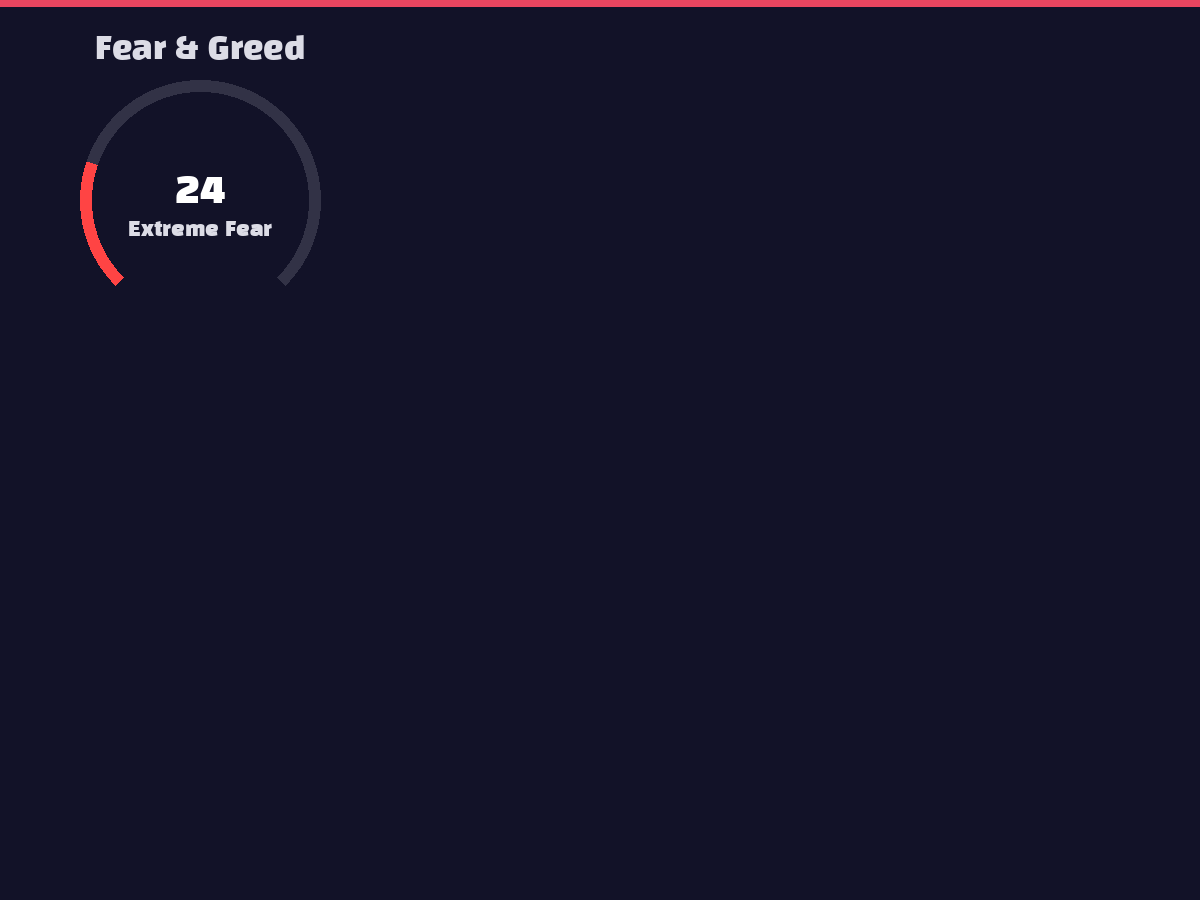
Sentiment indicators reflect extreme conservative positioning. The Fear & Greed Index at 23 indicates "Extreme Fear," showing excessive pessimism among market participants. Search trends remain subdued: XRP (22), Macroeconomic (15), and ETF/Regulatory (9). The FOMO spread at 0.0 indicates absence of panic buying behavior. The XRP/BTC interest ratio of 1.0192 shows balanced attention relative to Bitcoin. Overall sentiment suggests potential market bottom formation through extreme bearishness.
6. 🐋 On-Chain Activity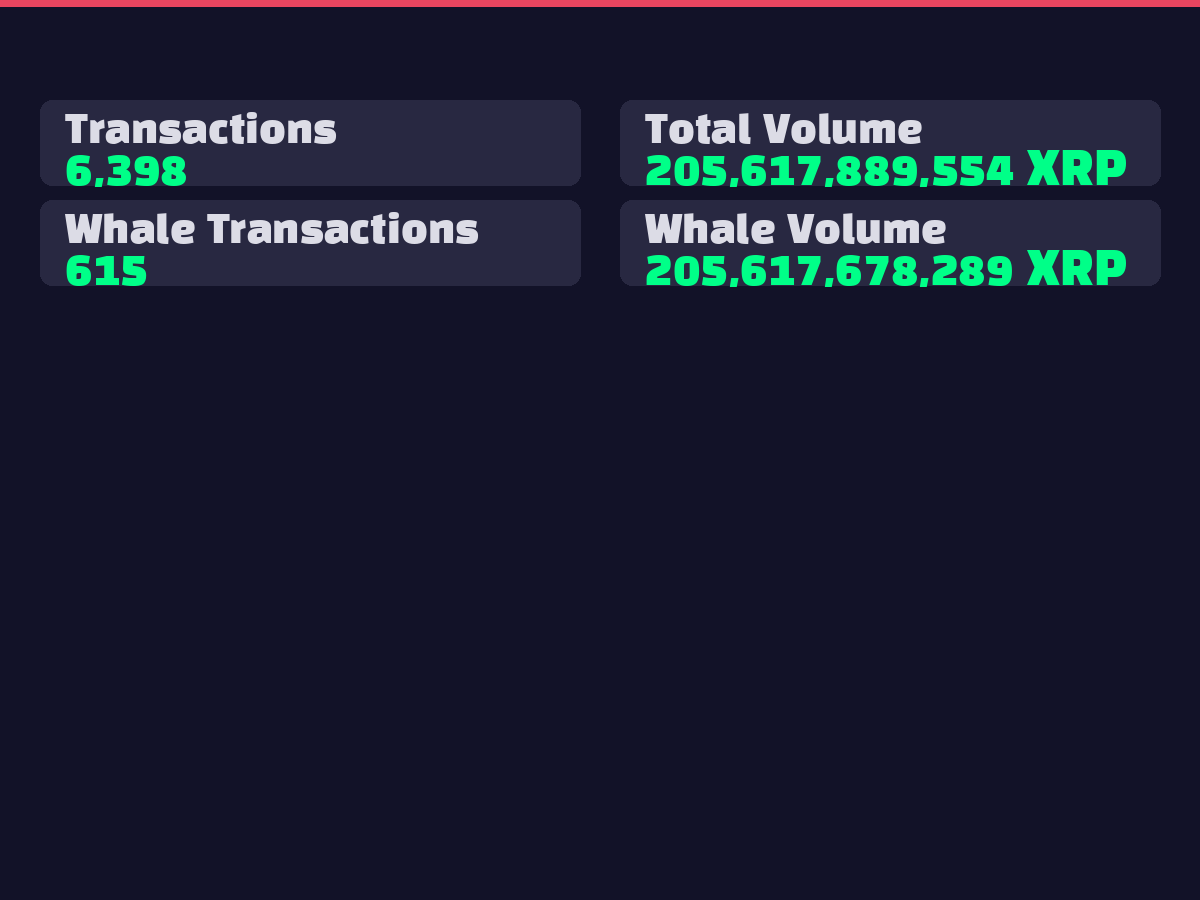
On-chain data reveals significant whale activity. Total transactions of 5,652 moved 3,036,070,173,958 XRP, with whale transactions comprising 248 trades handling 3,036,070,044,250 XRP. Whale transactions representing nearly 100% of total volume indicates concentrated large investor repositioning. This pattern typically emerges at market inflection points, suggesting institutional smart money positioning.
7. 📈 Elliott Wave / Wyckoff Analysis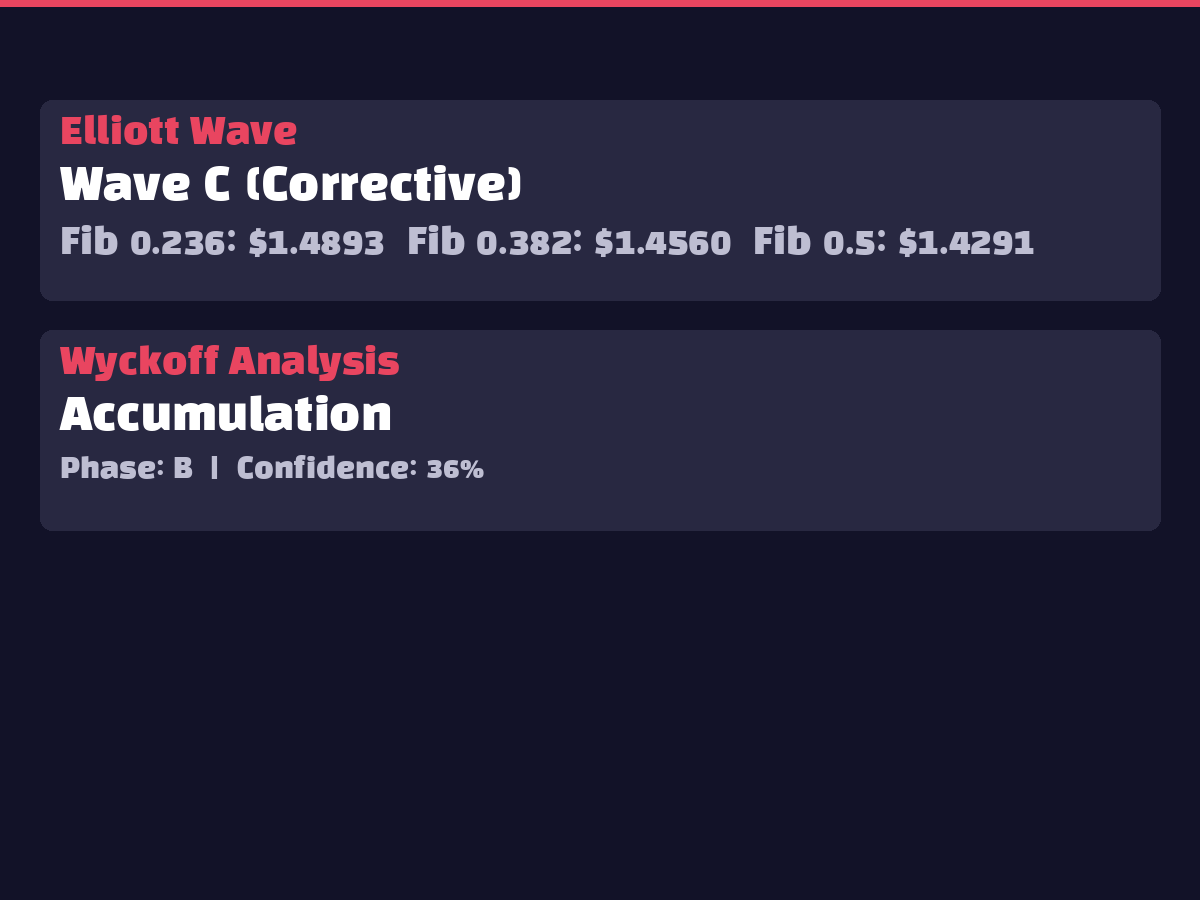
Elliott Wave analysis places XRP in a C-wave (corrective) phase. Wyckoff analysis identifies an Accumulation phase at Stage B, though confidence remains low at 36%. The accumulation phase represents smart money accumulation at lower prices, with Stage B potentially leading to upward reversal after additional downside testing. However, low confidence suggests additional observation is required for pattern confirmation.
8. 🤖 AI Prediction Interpretation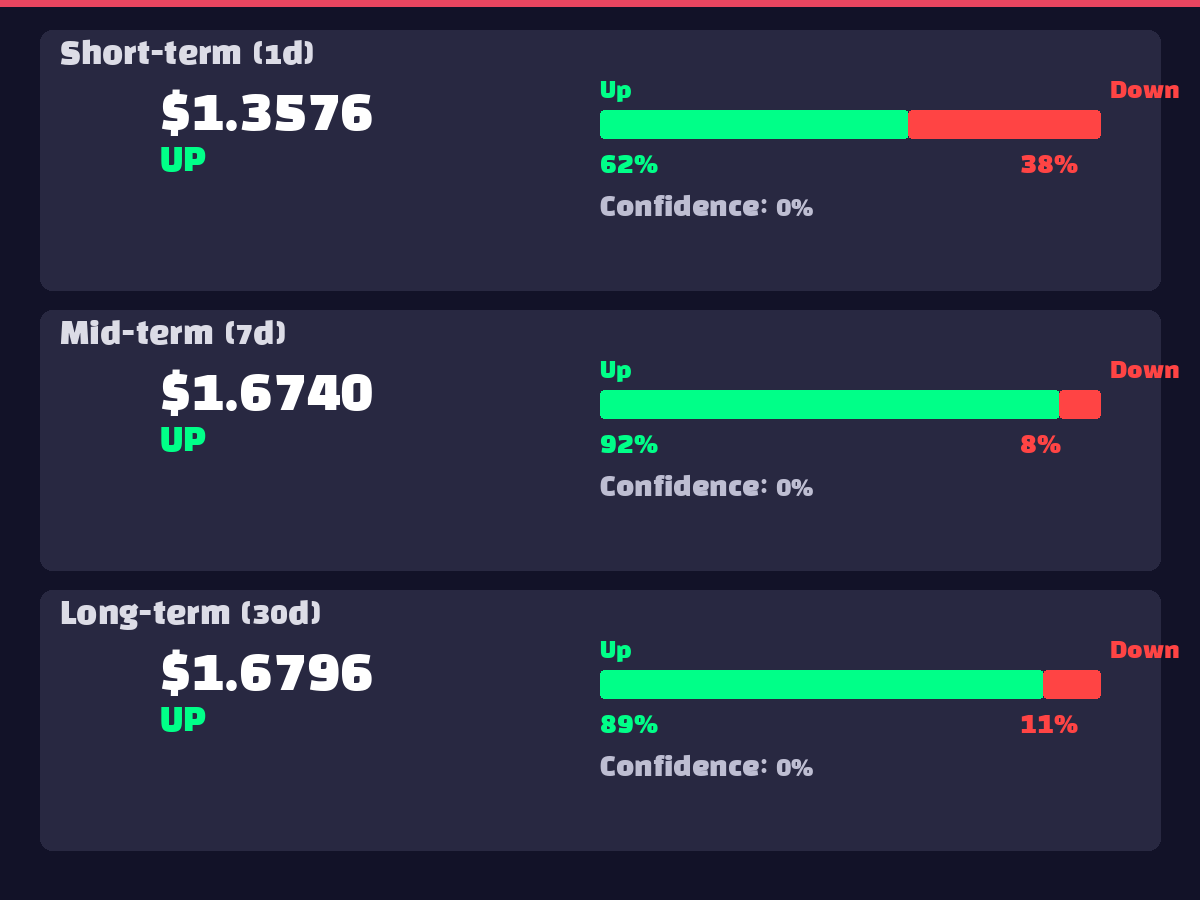
AI ensemble models project strong bullish scenarios. Short-term (1-day) prediction of $1.3576 (₩2,047) with 61.7% upside probability, medium-term (7-day) $1.6740 (₩2,524) with 91.9% probability, and long-term (30-day) $1.6796 (₩2,533) with 88.8% probability. The ~90% confidence in medium-to-long-term predictions suggests models identify current prices as significant bottoms. The sharp increase from 1-day to 7-30-day predictions indicates short-term consolidation followed by strong recovery.
9. ⚠️ Risk Factors
10. ✅ Overall Assessment
Recommendation: Wait and Accumulate Gradually
XRP currently presents a complex scenario where extreme bearish sentiment and technical weakness coexist with strong AI bullish predictions and Wyckoff accumulation signals.
Key Rationale:
Trading Strategy:
A staged accumulation strategy is recommended considering downside risks, with full positioning advised after Wyckoff accumulation completion confirmation.