1. 📌 Market Summary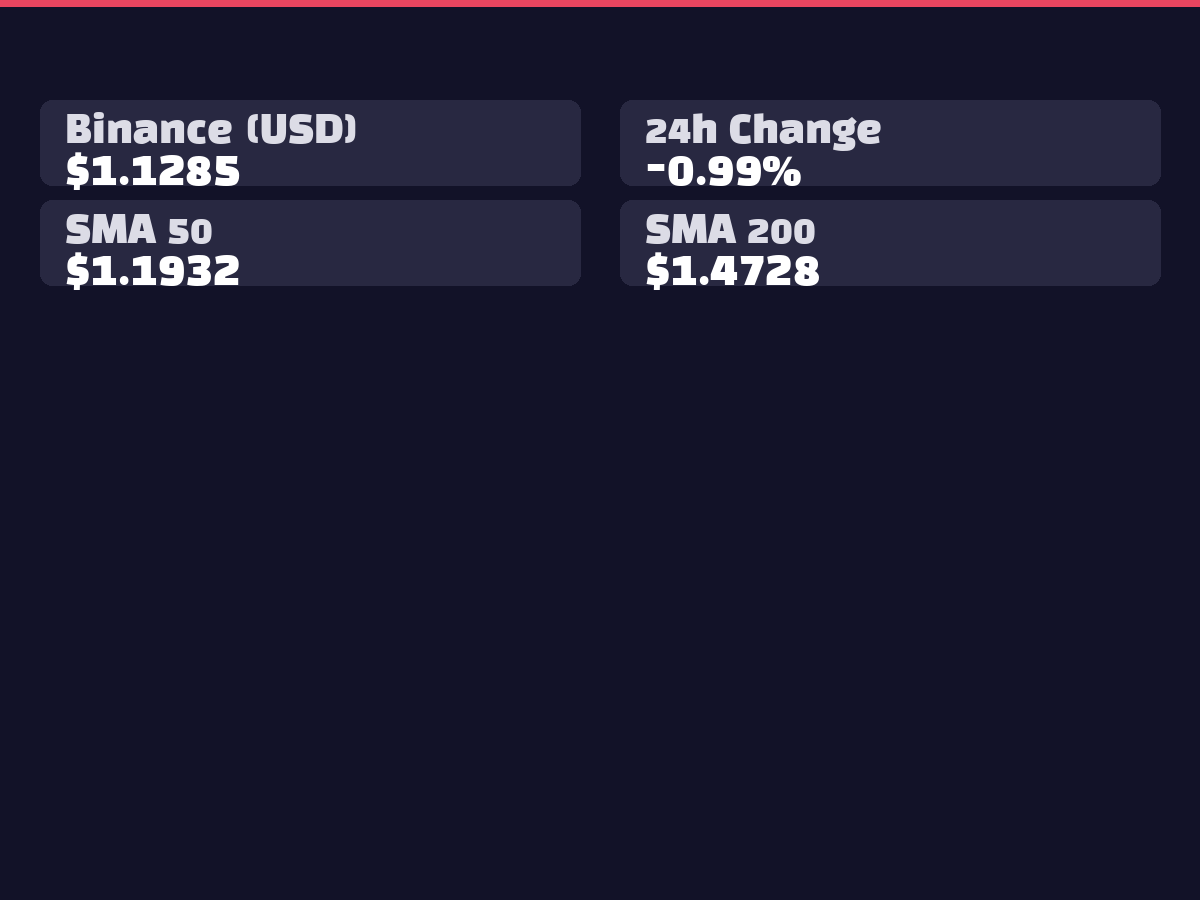
XRP is currently trading at $1.1442, showing a modest decline of -1.26% over the past 24 hours. The Bithumb KRW price stands at ₩1,717 with a -1.60% change. Trading volume remains robust at 83,955,361 XRP over 24 hours, while AI prediction models indicate a high probability of 96.8% for near-term upside, suggesting strong technical rebound potential. The asset appears to be finding support at the $1.1095 low and is currently seeking to regain upward momentum.
2. 📊 Technical Analysis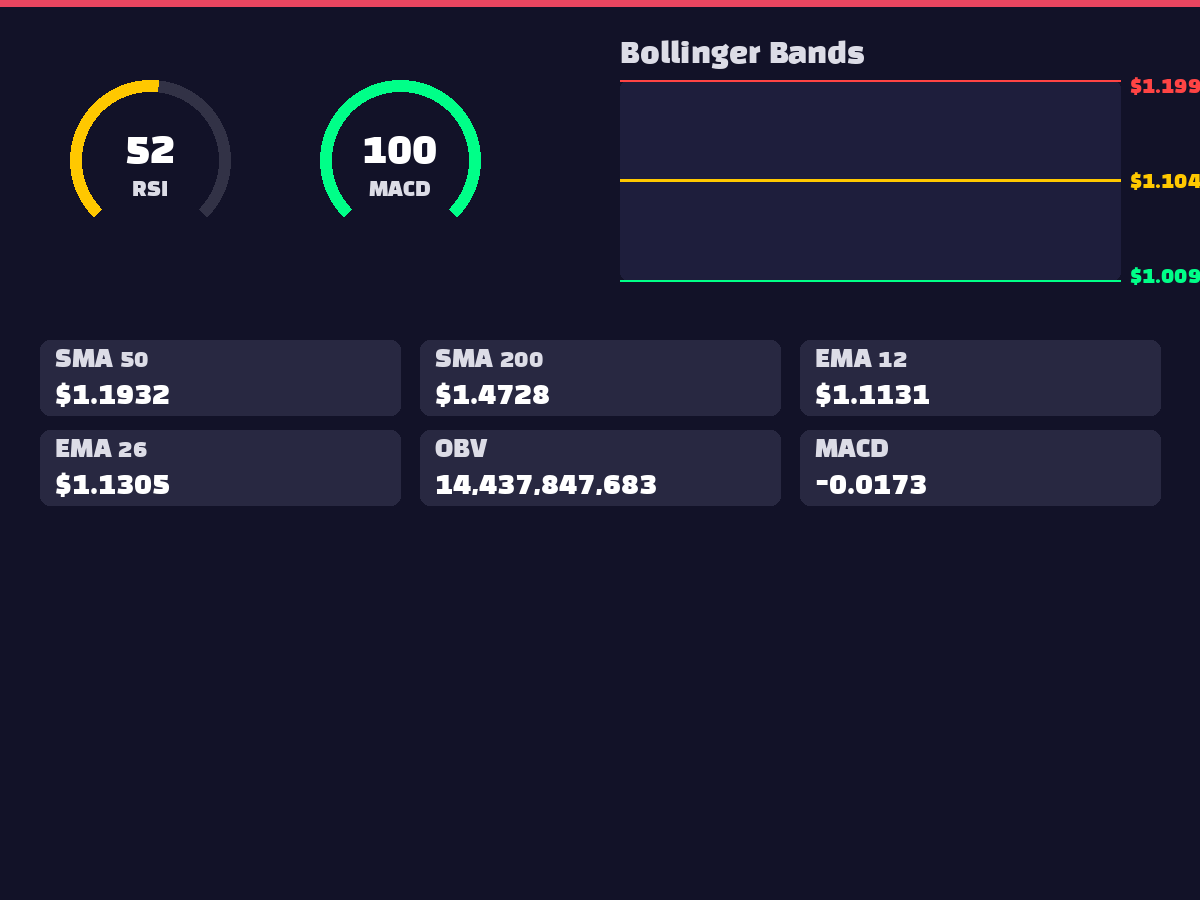
RSI sits at 52.44 in neutral territory, indicating a balanced state away from overbought/oversold conditions. MACD at -0.0173 remains in negative territory, but the histogram has turned positive at 0.0167, signaling a potential bullish momentum shift. Bollinger Band analysis shows the current price trading above the middle line (1.1048), indicating upward pressure. Moving averages reveal trading above the 5-day (1.1365) and 20-day (1.1048) lines, though below the 50-day (1.1932) and 200-day (1.4728) averages. The 50-day deviation of -4.00% and 100-day deviation of -11.38% suggest ongoing medium-term correction, while OBV at 14,437,847,683 shows supportive volume backing.
3. 🌍 International Situation & Macroeconomic Factors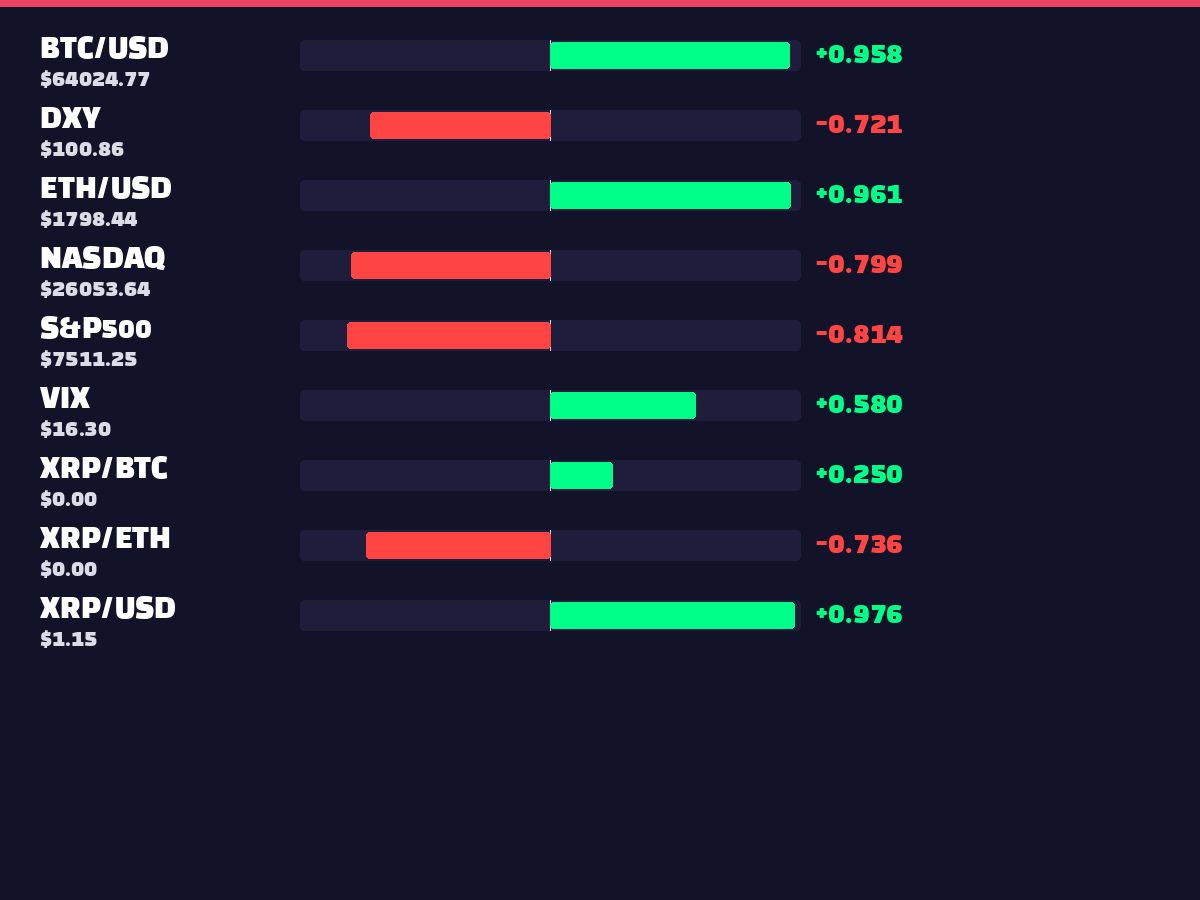
No specific international geopolitical developments were identified in the collected news data. Correlation analysis reveals very strong positive relationships with BTC (0.9731) and ETH (0.9694), indicating alignment with broader cryptocurrency market movements. XRP shows a negative correlation with DXY (-0.7158), suggesting vulnerability to dollar strength. Traditional equity markets display negative correlations with S&P500 (-0.7942) and NASDAQ (-0.7758), while VIX shows a positive correlation of 0.5656, indicating XRP tends to move with increased market volatility.
4. ⚖️ Regulatory & Legal Environment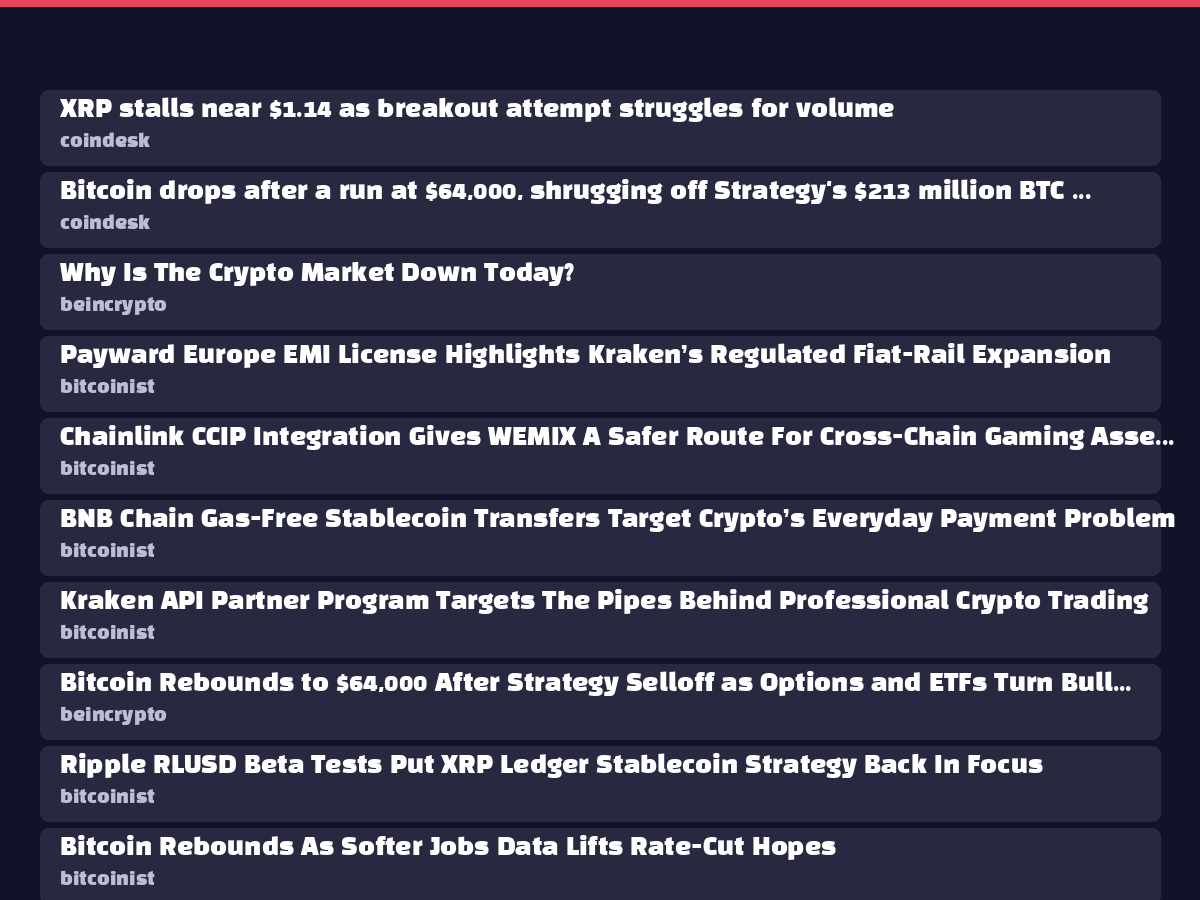
No major regulatory developments were identified in the current news collection. However, the XRP ETF market shows active trading across 6 products with total estimated net inflows of $21.9M, demonstrating continued institutional interest. The highest inflows are recorded by XRP ($8.4M), XXRP ($5.5M), and XRPT ($4.1M), confirming solid demand for indirect investment exposure through ETF vehicles.
5. 😱 Market Sentiment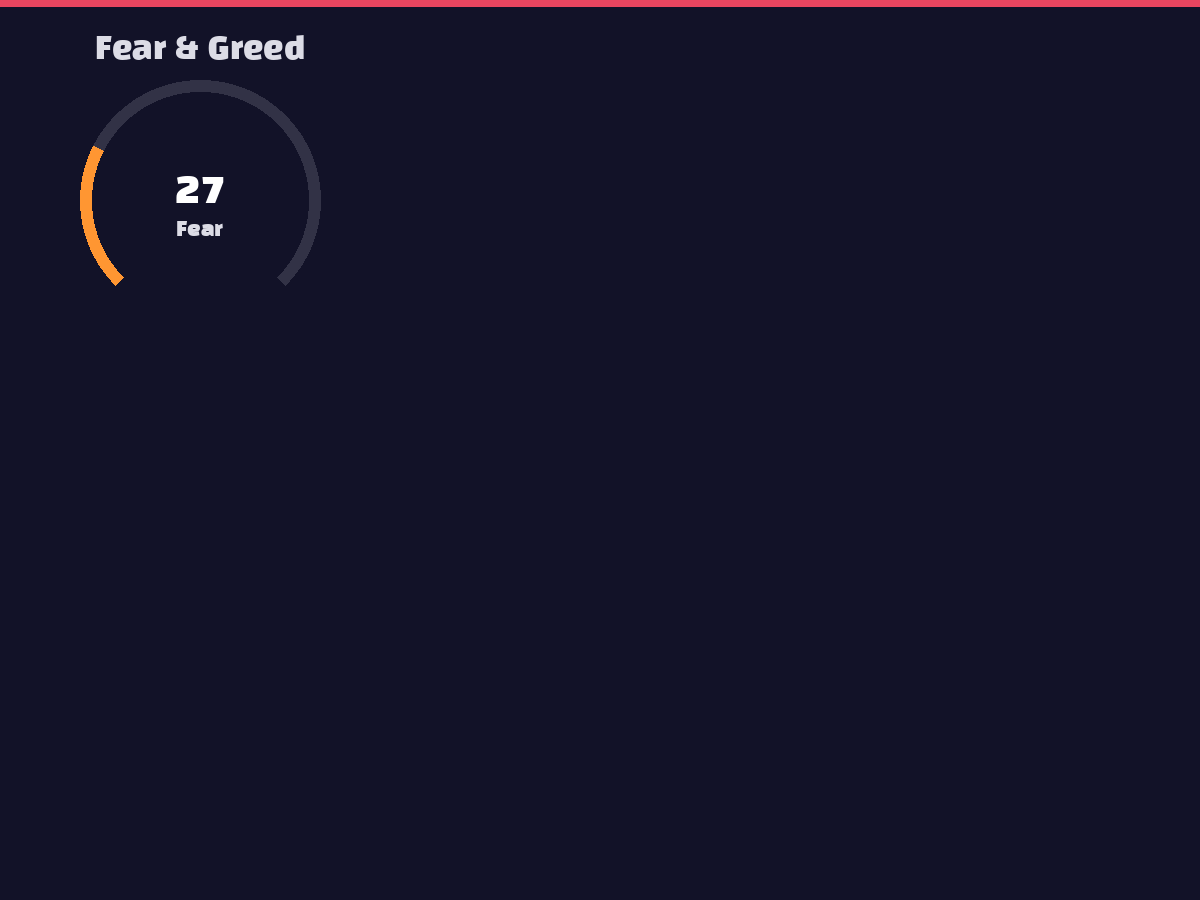
The Fear & Greed Index stands at 27, indicating extreme fear levels with predominantly negative market sentiment. This extreme fear situation can paradoxically serve as a contrarian indicator suggesting potential bottom formation. Despite the high fear index, continued net inflows into XRP ETFs suggest a divergence between long-term institutional investors and short-term retail sentiment. On-chain data reveals 792 whale transactions with volume reaching 1,095,307,941,943 XRP, indicating active large investor movements.
6. 🐋 On-Chain Activity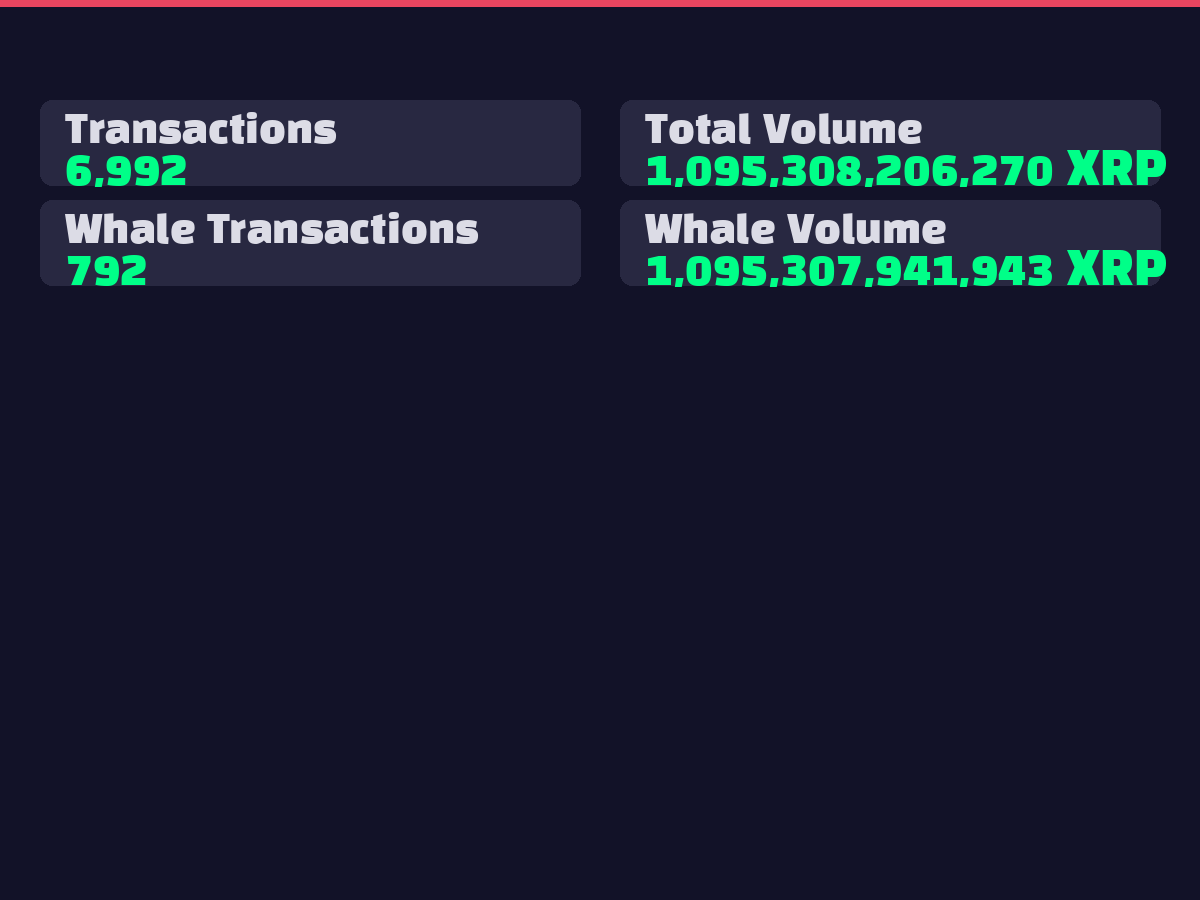
Whale transactions total 792 deals, representing the majority of the total volume of 1,095,307,941,943 XRP, indicating aggressive position adjustments by institutional and large investors. The high proportion of whale transactions relative to the total network activity of 6,992 transactions suggests institutional money is driving market movements rather than retail investors. The total transaction volume of 1,095,308,206,270 XRP represents elevated levels compared to daily averages, which is a typical pattern observed at important price inflection points. This concentrated large-scale trading activity is expected to serve as a crucial signal for future directional decisions.
7. 📈 Elliott Wave / Wyckoff Analysis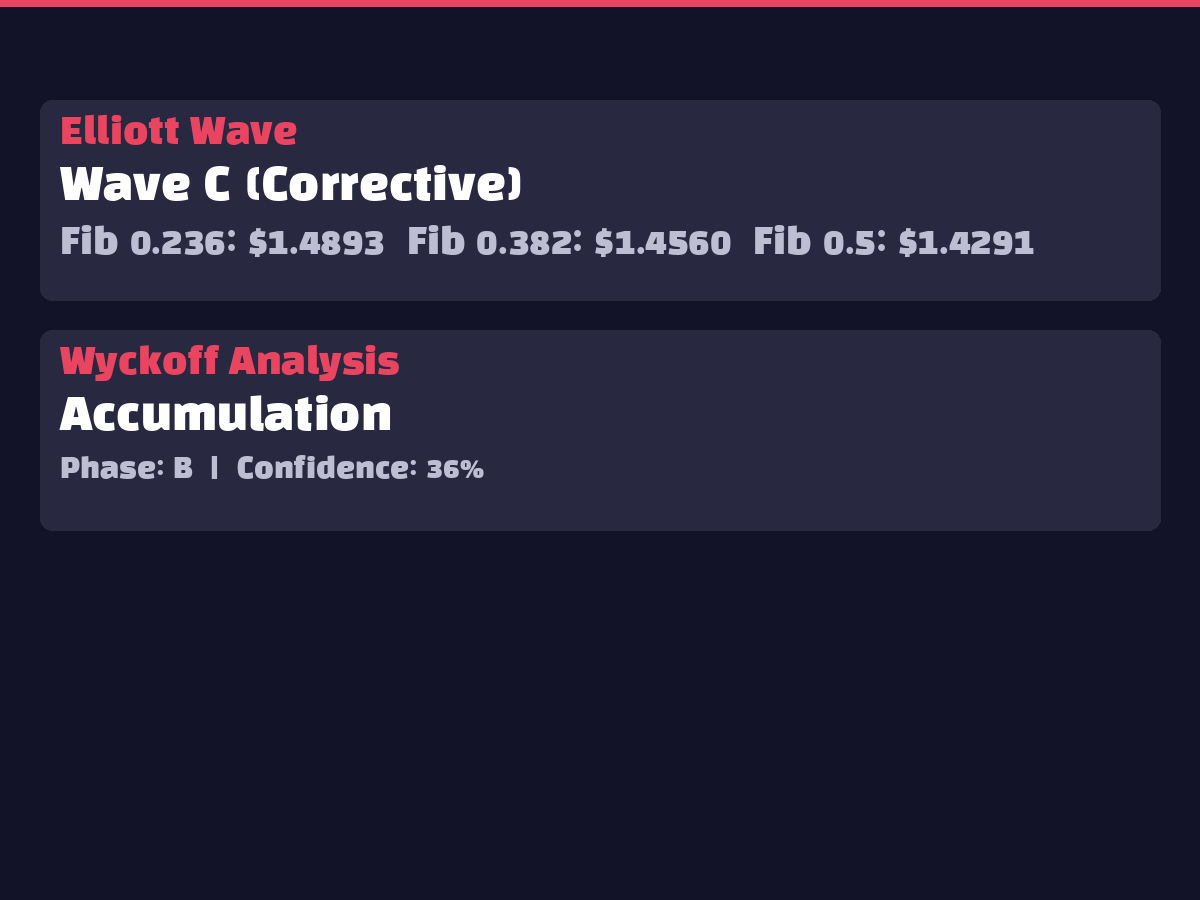
Elliott Wave analysis places XRP currently in Wave C of a corrective pattern, suggesting the downward correction is nearing completion. Wyckoff analysis indicates an Accumulation phase at Stage B with 36% confidence level. Stage B of the accumulation phase typically involves retesting and shakeout activities, representing a period when smart money accumulates positions. The completion of Wave C correction and progression through the accumulation stage increases the probability of a transition to an upward wave pattern in the medium to long term.
8. 🤖 AI Prediction Results Interpretation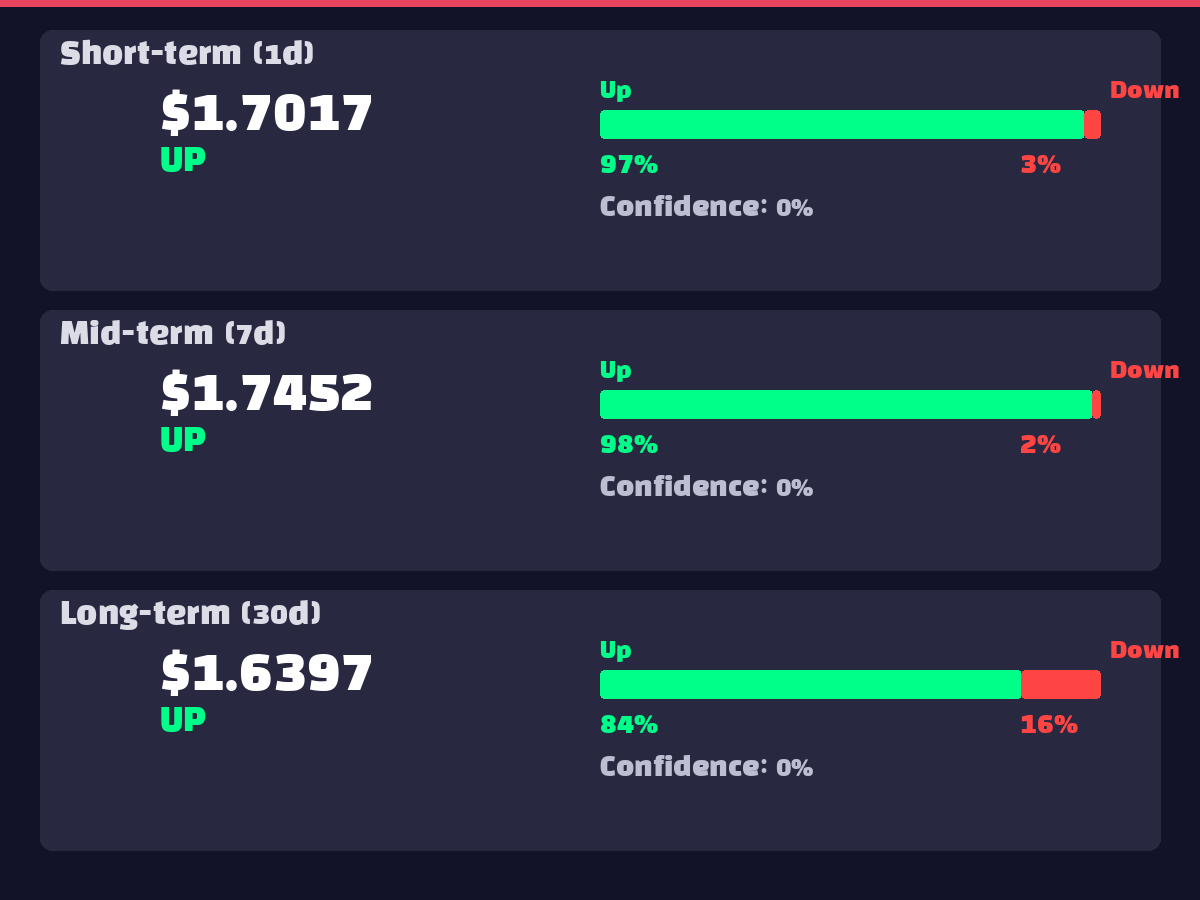
AI ensemble prediction models show strong bullish signals across all timeframes. The 1-day prediction targets $1.7017 (₩2,554), representing a 48.8% increase with 96.8% probability of upside. The 7-day prediction aims for $1.7452 (₩2,619), indicating a 52.6% gain with 98.5% upward probability. The 30-day prediction suggests $1.6397 (₩2,461) for a 43.3% increase, though with a somewhat lower probability of 84.2%. The pattern of increasing targets and probabilities from short to medium-term suggests strong upward momentum, while the slight decline in long-term targets reflects potential technical correction considerations.
9. ⚠️ Risk Factors
10. ✅ Overall Assessment
Recommendation: BUY (Staged Entry)
XRP currently presents an attractive entry opportunity where technical bottom formation, strong AI model upside signals, and Wyckoff accumulation phase converge.
Key Supporting Arguments:
Specific Entry Strategy: