XRP Market Analysis Report
Analysis Time: 2026-07-08 07:09 (UTC)
1. 📌 Market Summary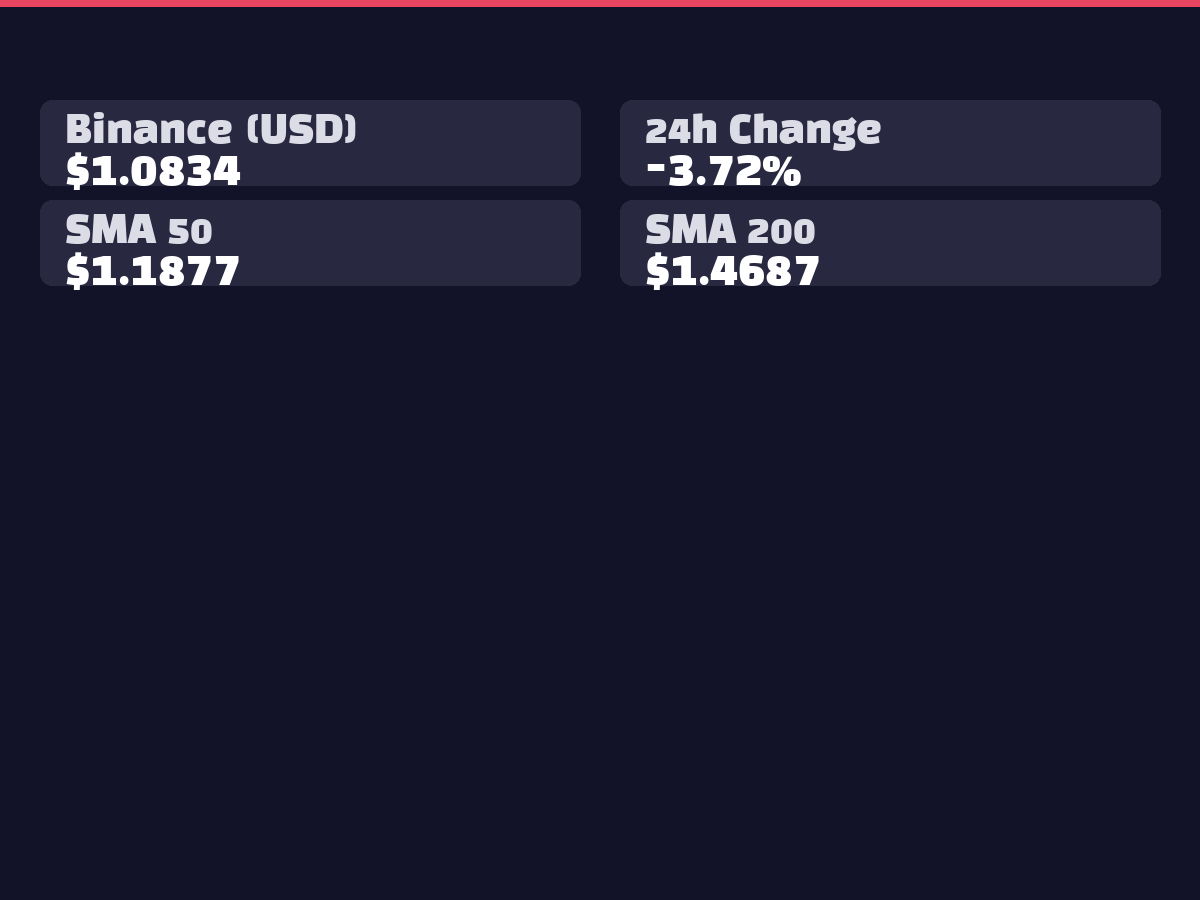
XRP is currently trading at $1.0893, recording a -3.80% decline over the past 24 hours. Bithumb's KRW price stands at ₩1,625, showing a similar bearish trend with -4.36% decline. Trading volume remains active at 75.88 million XRP over 24 hours, while the current price is finding support near the Bollinger Band middle line ($1.1010). The Fear & Greed Index at 20 indicates extreme fear sentiment dominating the market, yet AI prediction models forecast strong short-term upside, presenting contrasting signals.
2. 📊 Technical Analysis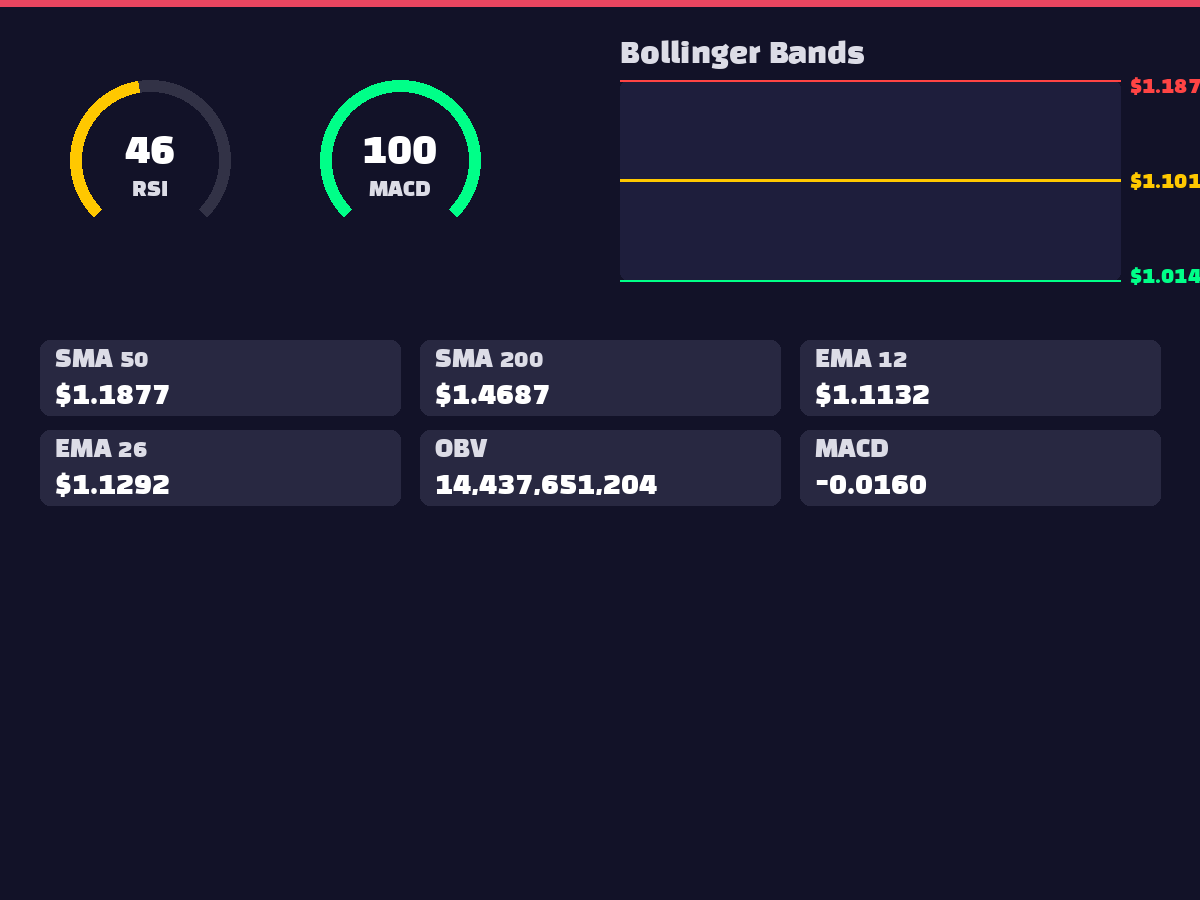
The RSI(14) currently sits at 46.74, showing neutral territory with slight bearish bias approaching oversold conditions. MACD at -0.0160 remains above the signal line at -0.0304 with a positive histogram of 0.0144, suggesting emerging upward momentum recovery. Within the Bollinger Bands, the current price is supported near the middle line ($1.1010) with sufficient distance from the lower band ($1.0142), limiting further downside potential. Moving average analysis shows major resistance at SMA50 ($1.1877), with current price positioned below all major moving averages, maintaining an overall bearish structure. Distance ratios show -6.25% from 50-day and -24.19% from 200-day averages, indicating substantial decline with high rebound probability.
3. 🌍 Global Situation and Macroeconomics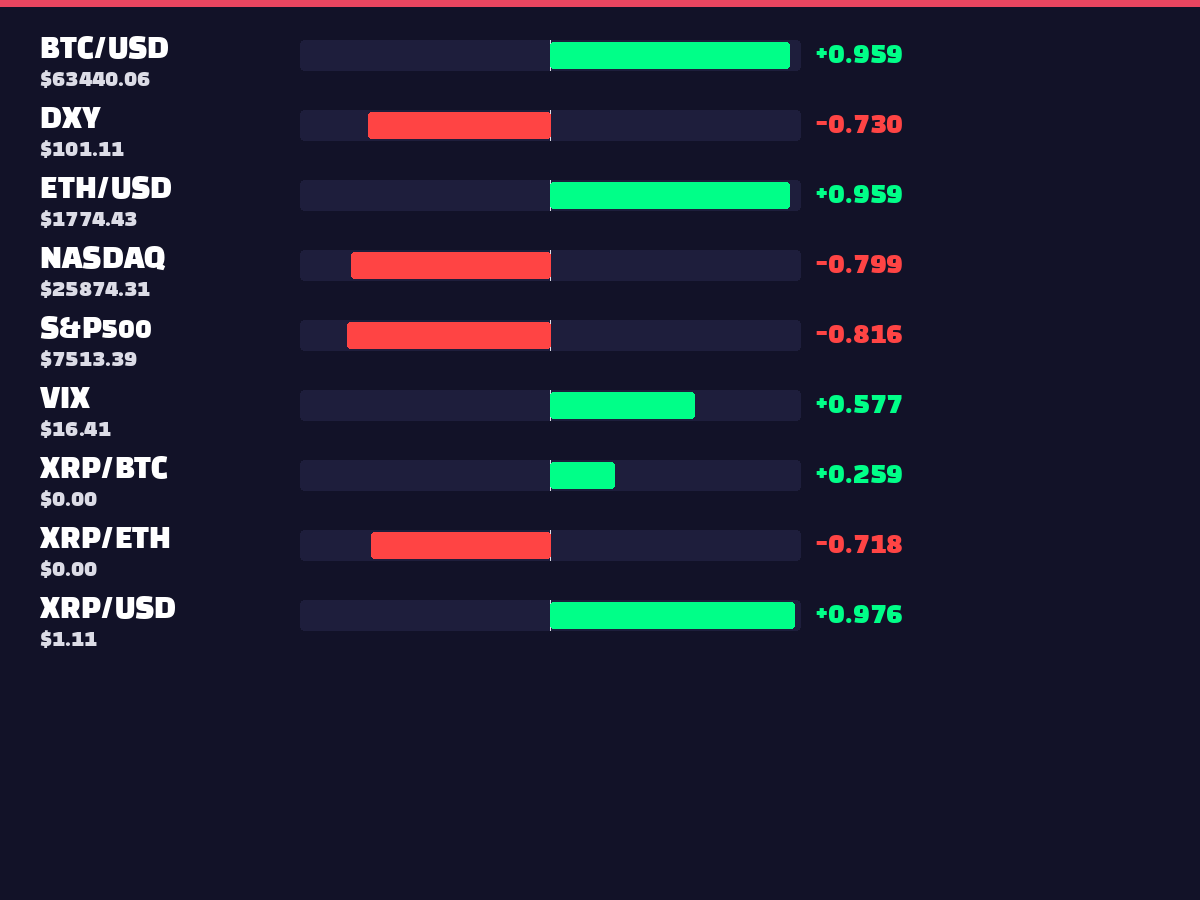
No major international geopolitical developments were identified in the current news collection. Correlation data reveals a strong negative correlation of -0.7295 with DXY, indicating dollar strength negatively impacts XRP. Strong negative correlations with major US indices S&P500 (-0.8160) and NASDAQ (-0.7991) suggest that traditional market rallies lead to cryptocurrency fund outflows. The positive correlation of 0.5871 with VIX indicates XRP tends to move with market volatility and uncertainty levels.
4. ⚖️ Regulatory and Legal Environment
No major regulatory changes were identified in the current news collection. The XRP ETF market shows 6 products actively trading with a combined net inflow of $7.8M, confirming sustained institutional interest. Notably, the XRP ($12.53) product recorded the largest net inflow of $5.9M, while XXRP ($23.54) also showed healthy inflows of $2.6M.
5. 😱 Market Sentiment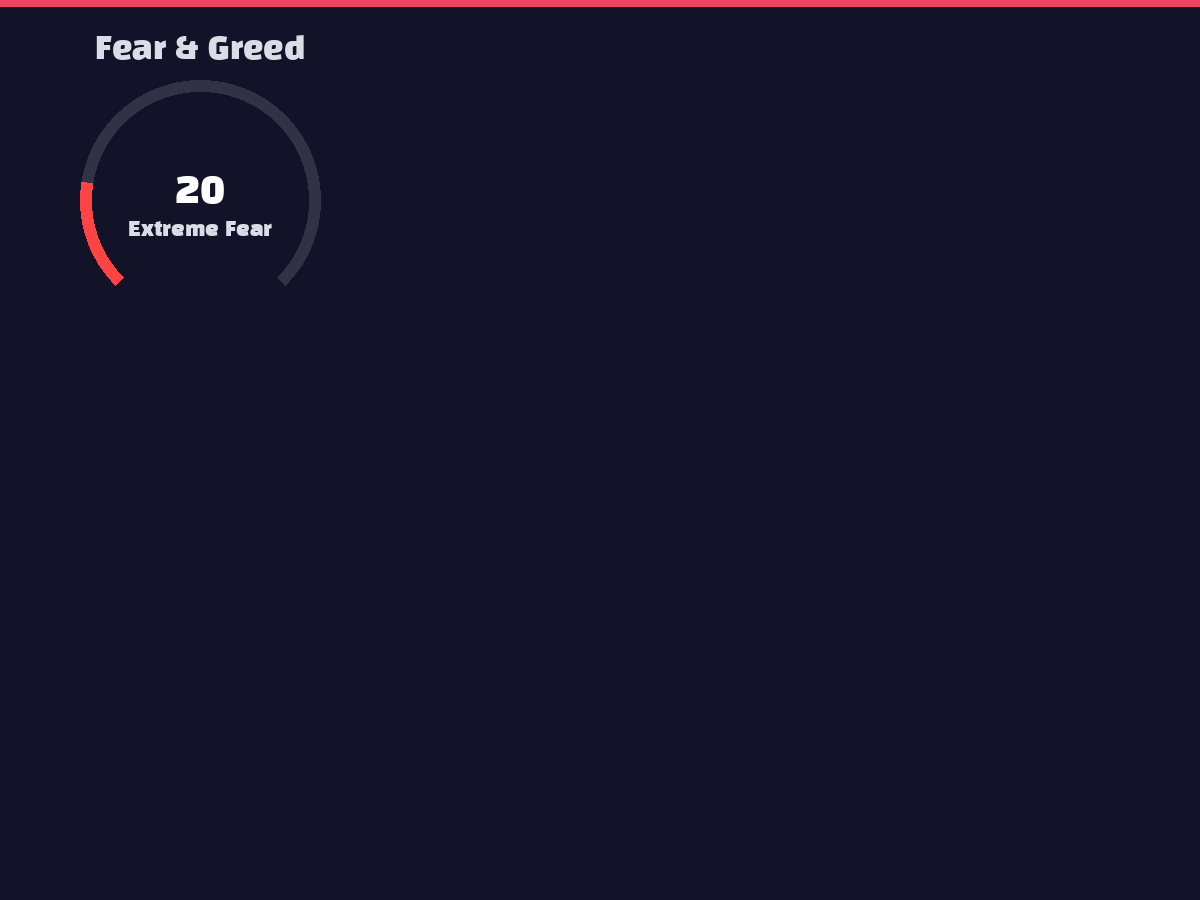
The Fear & Greed Index at 20 indicates extreme fear conditions, which paradoxically often presents buying opportunities. Historical data shows frequent short-term rebounds when the index drops below 20. Very high correlations with BTC (0.9588) and ETH (0.9596) demonstrate strong cryptocurrency market synchronization, making Bitcoin and Ethereum movements directly influential on XRP. The market is currently dominated by typical fear-driven selling psychology.
6. 🐋 On-Chain Activity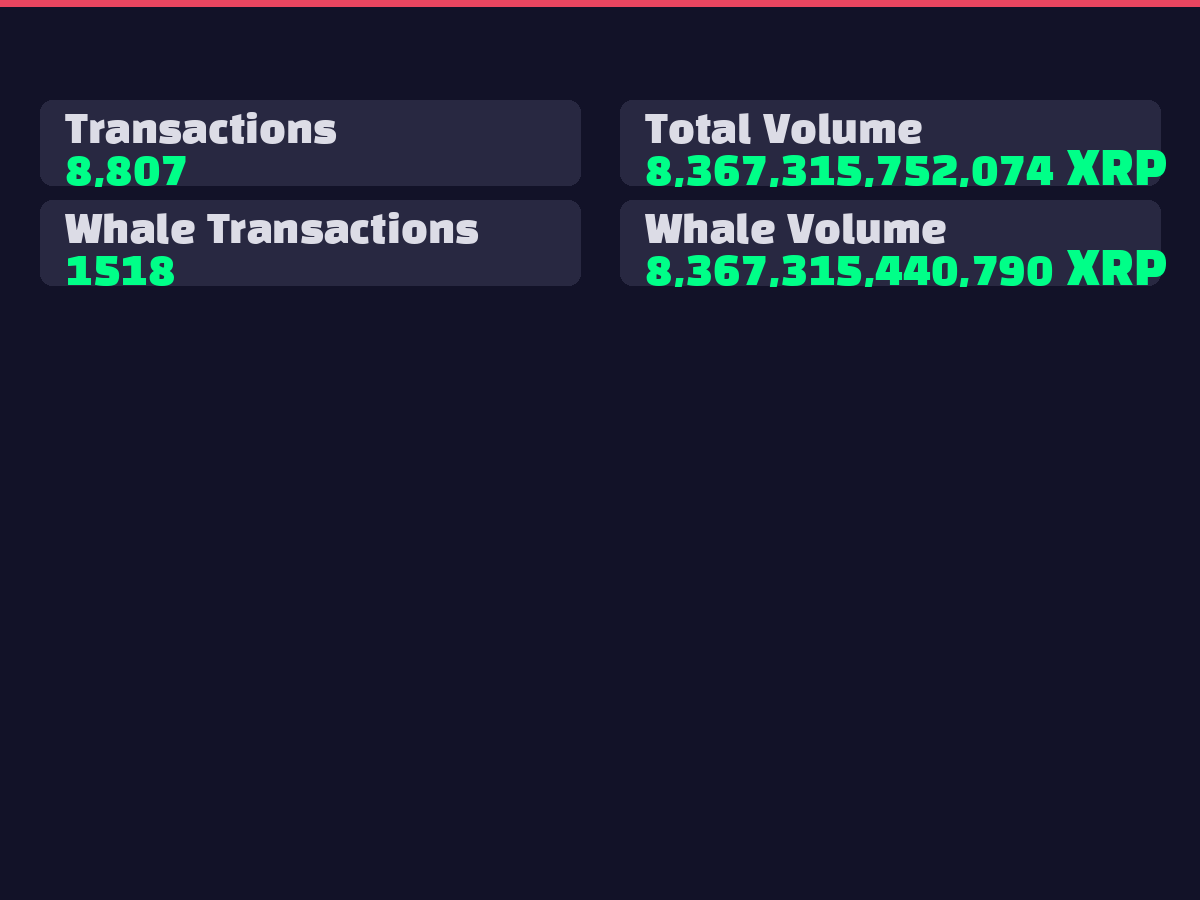
On-chain data shows daily transaction count at 8,807, maintaining moderate activity levels. Whale transactions reached 1,518 transactions involving 8,367,315,440,790 XRP, representing the majority of total trading volume. This indicates active position adjustments by large investors, serving as a primary source of current downward pressure. However, such large-scale transactions can also signal upcoming volatility expansion and rapid directional changes, requiring careful monitoring.
7. 📈 Elliott Wave / Wyckoff Analysis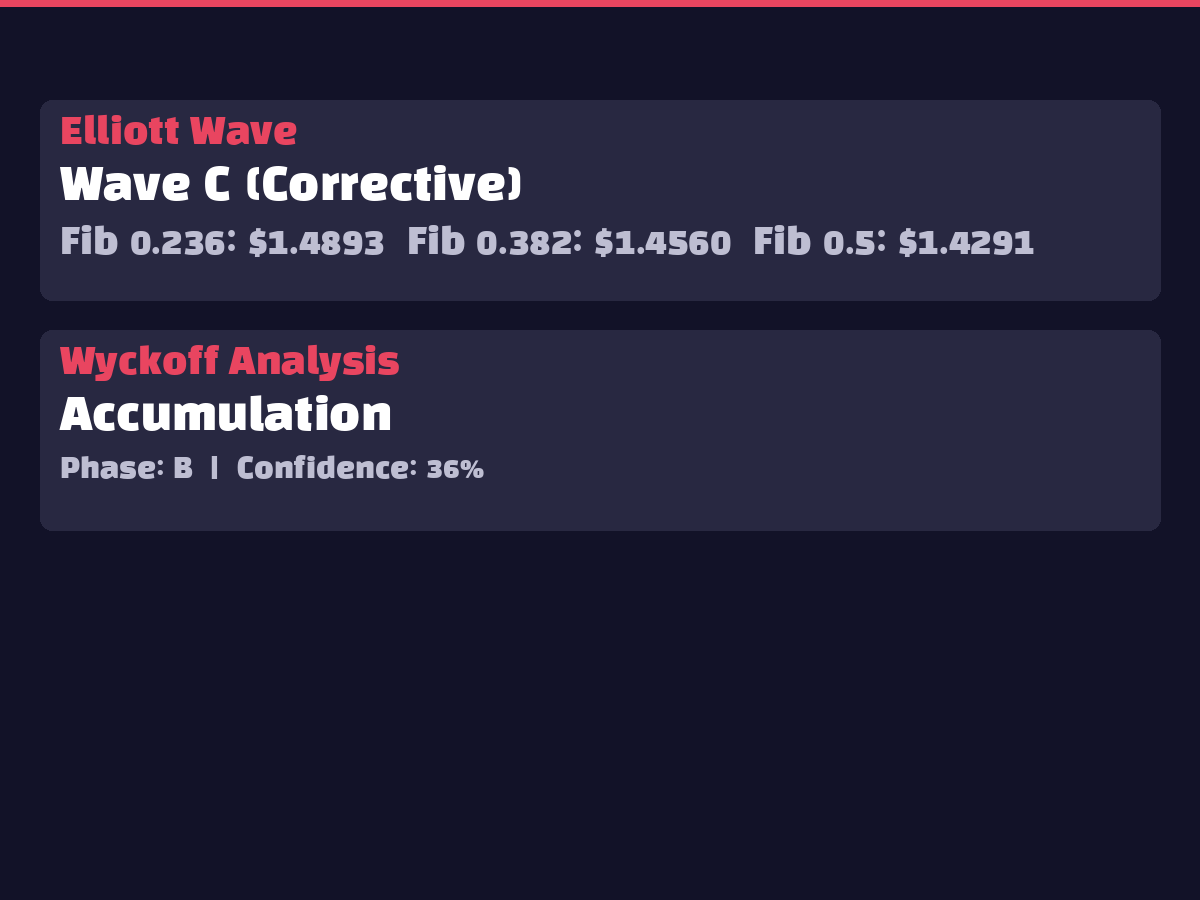
Current Elliott Wave analysis positions XRP in wave C (corrective), suggesting the downward correction is approaching completion. Wyckoff analysis indicates Accumulation phase B with 36% confidence, representing an uncertain transitional period. This suggests smart money accumulation at lower levels, though clear upward reversal signals haven't emerged yet. Typically, late accumulation phases show volatility compression followed by sharp upward breakouts.
8. 🤖 AI Prediction Analysis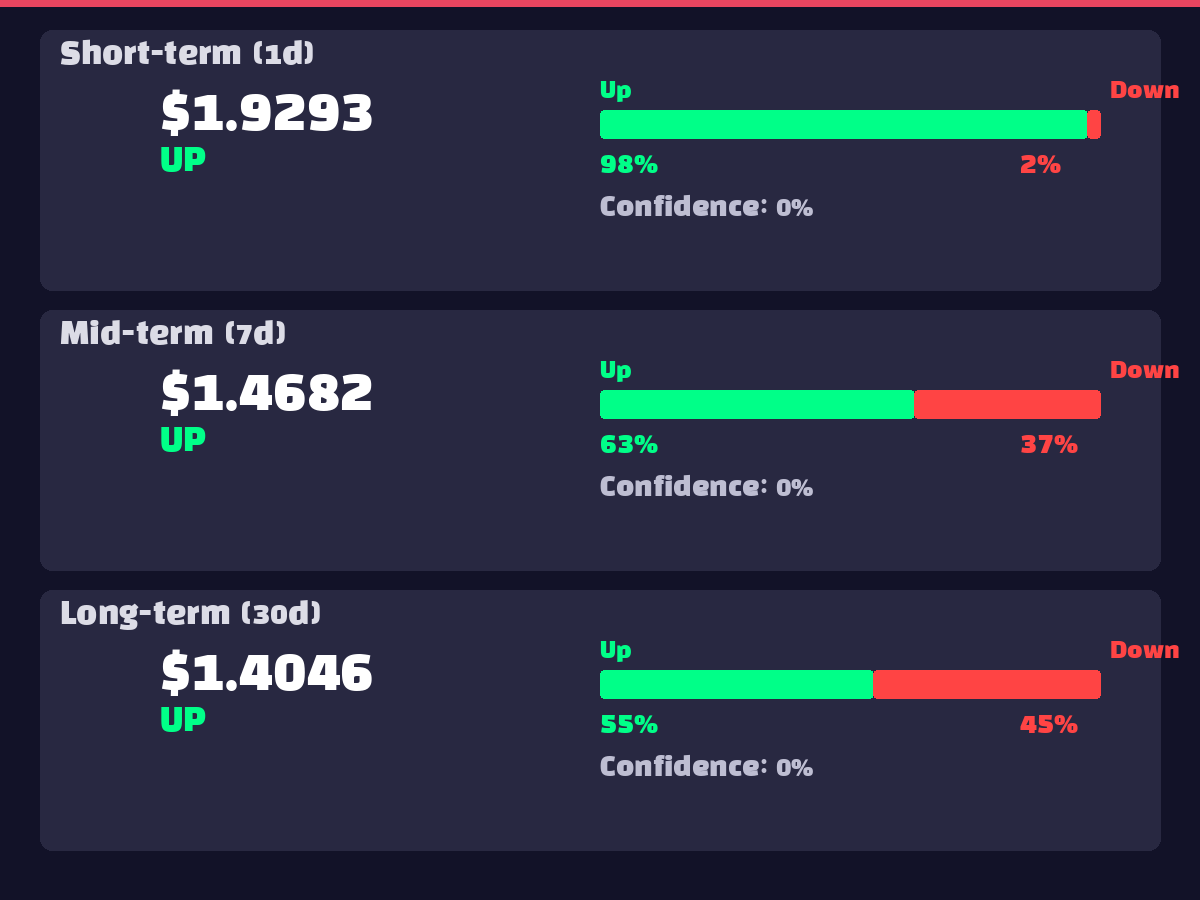
AI ensemble predictions present fascinating patterns. The 1-day forecast projects $1.9293 (₩2,878), representing 77% upside with 97.5% probability. The 7-day prediction shows $1.4682 (₩2,190) for 35% gains with 62.9% upward probability. The 30-day forecast indicates $1.4046 (₩2,095) for 29% appreciation with 54.8% probability. This suggests a scenario of sharp short-term rally followed by gradual consolidation and stabilization, with AI detecting technical rebound signals contrary to current extreme fear sentiment.
9. ⚠️ Risk Factors
10. ✅ Comprehensive Opinion
Recommendation: Conditional Buy
XRP appears to be entering a technical rebound zone amid extreme fear sentiment. Combining AI models' strong short-term upside projections with Wyckoff accumulation signals suggests a low-price buying opportunity.
Key Rationale:
Trading Strategy:
Risk management through position sizing and strict stop-loss adherence is essential.