XRP Market Analysis Report
Analysis Time: 2026-07-11 16:09 (KST) / 2026-07-11 07:09 (UTC)
1. 📌 Market Summary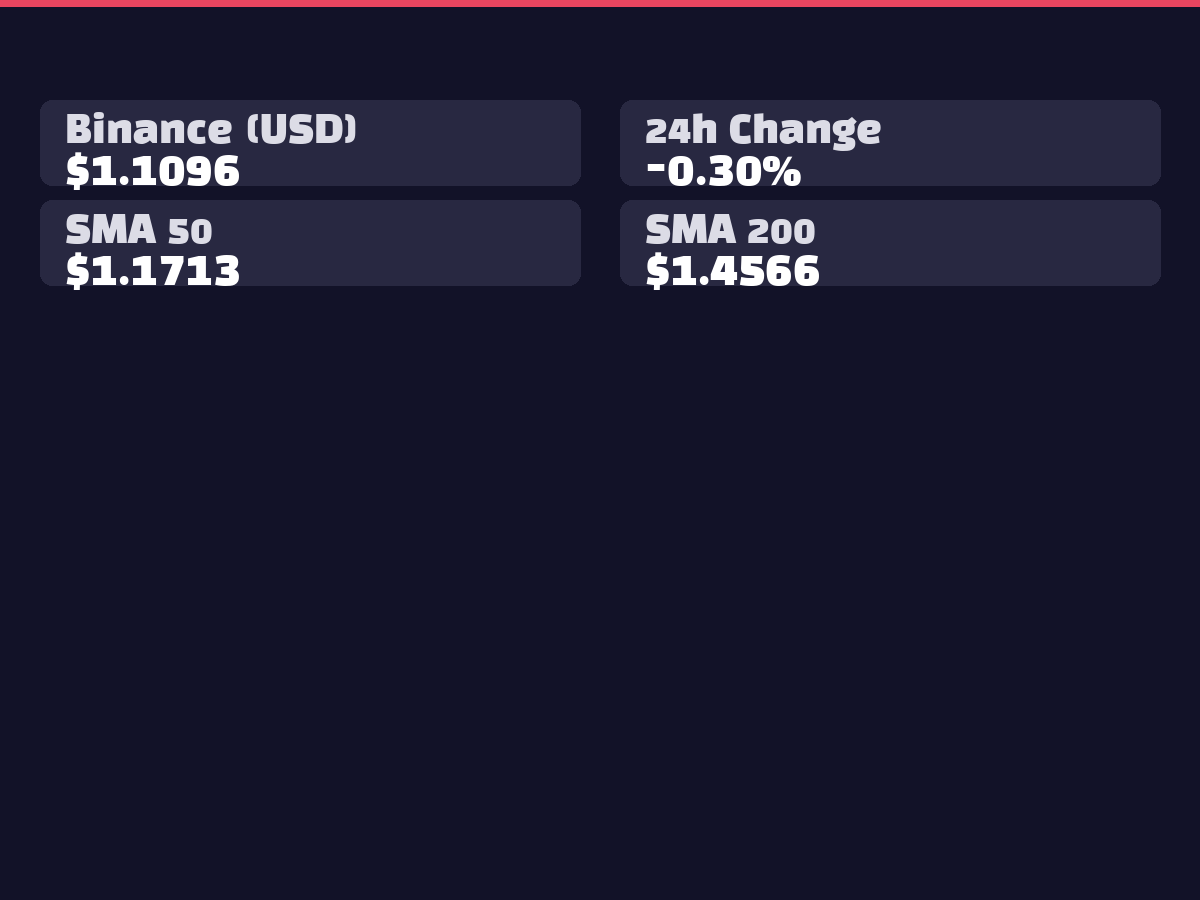
XRP is currently trading at $1.1075 on Binance, showing a modest +0.26% gain over the past 24 hours. The Bithumb KRW price stands at ₩1,652 with a similar +0.24% increase. With a moderate trading volume of 50,976,827 XRP, the asset is consolidating within the $1.0964-$1.1183 range. The neutral RSI at 45.60 and positive MACD histogram reversal suggest potential for near-term recovery momentum.
2. 📊 Technical Analysis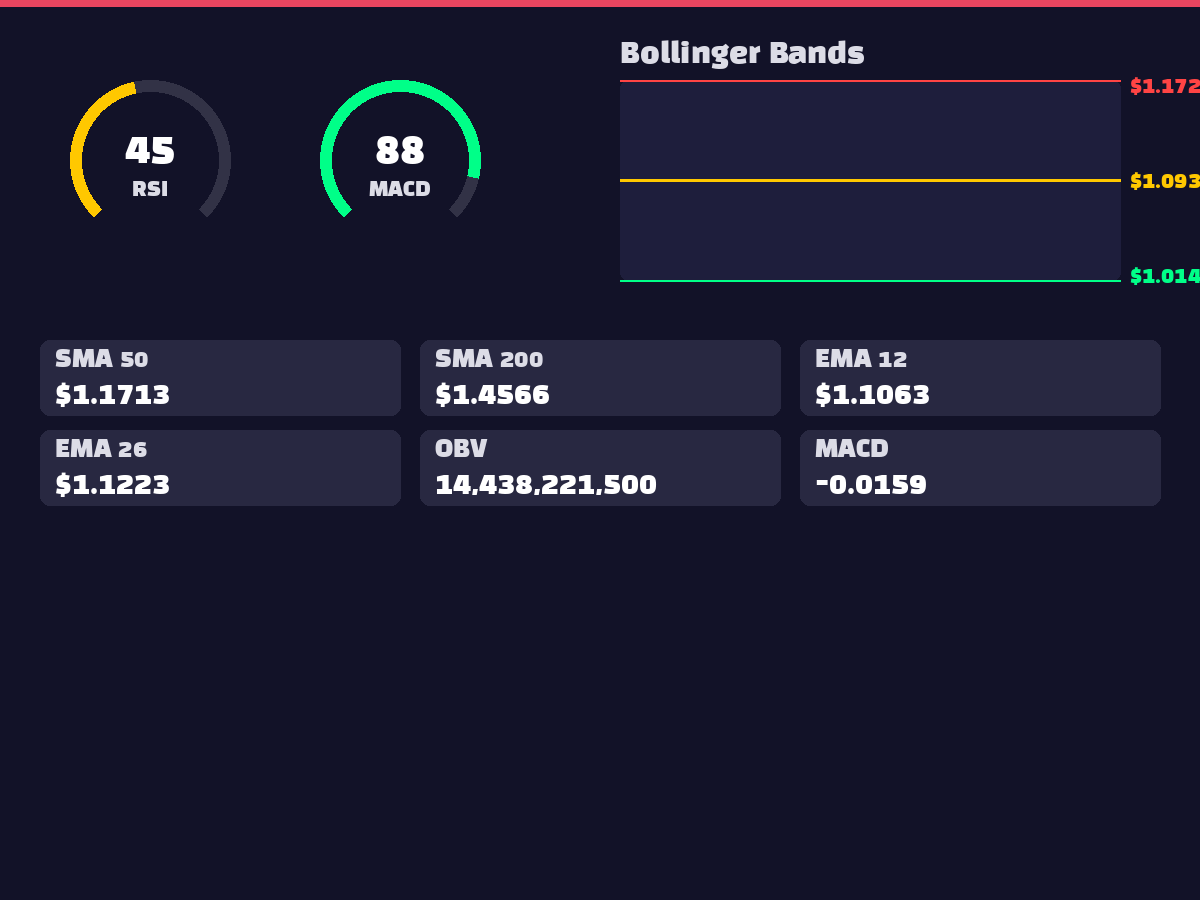
XRP displays neutral technical indicators across multiple timeframes. The RSI of 45.60 sits in a stable zone away from overbought/oversold territories, while MACD at -0.0159 remains negative but shows momentum improvement with a positive histogram reading of 0.0077. Bollinger Band analysis reveals the current price of $1.1075 finding support near the middle band at $1.0937, though significant gaps exist below the 50-day MA at $1.1713 (-5.89% deviation) and 200-day MA at $1.4566 (-24.32% deviation). The OBV at 14,438,221,500 suggests price movement lacks strong volume confirmation.
3. 🌍 International Situation and Macroeconomics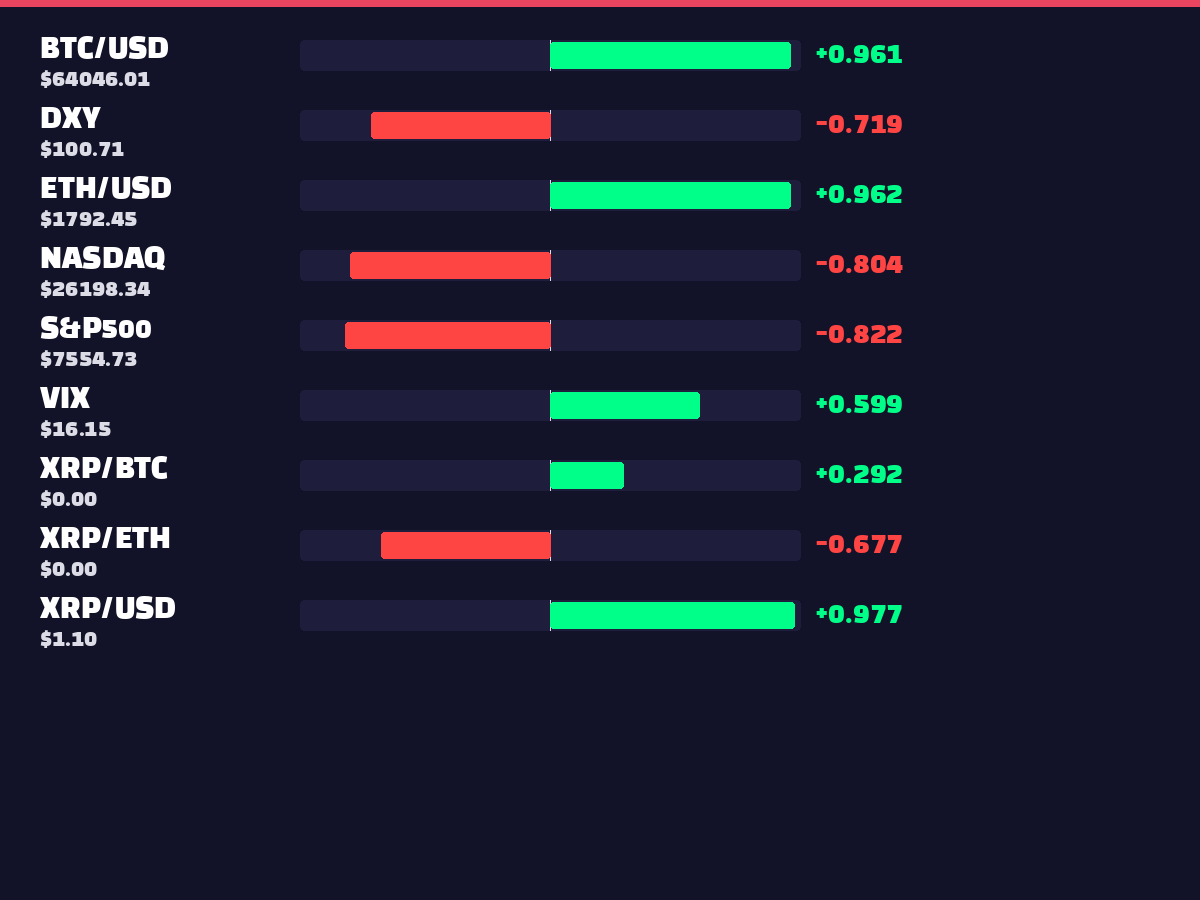
No significant international developments were identified in the current news feed. Correlation analysis reveals key relationships: DXY at $100.7140 shows a -0.7187 negative correlation, indicating XRP weakness during dollar strength periods. Strong negative correlations with S&P500 at $7,554.73 (-0.8221) and NASDAQ at $26,198.34 (-0.8038) suggest potential capital outflows from crypto during equity market rallies. The VIX correlation of 0.5992 at 16.15 indicates XRP volatility may increase during market uncertainty periods.
4. ⚖️ Regulatory and Legal Environment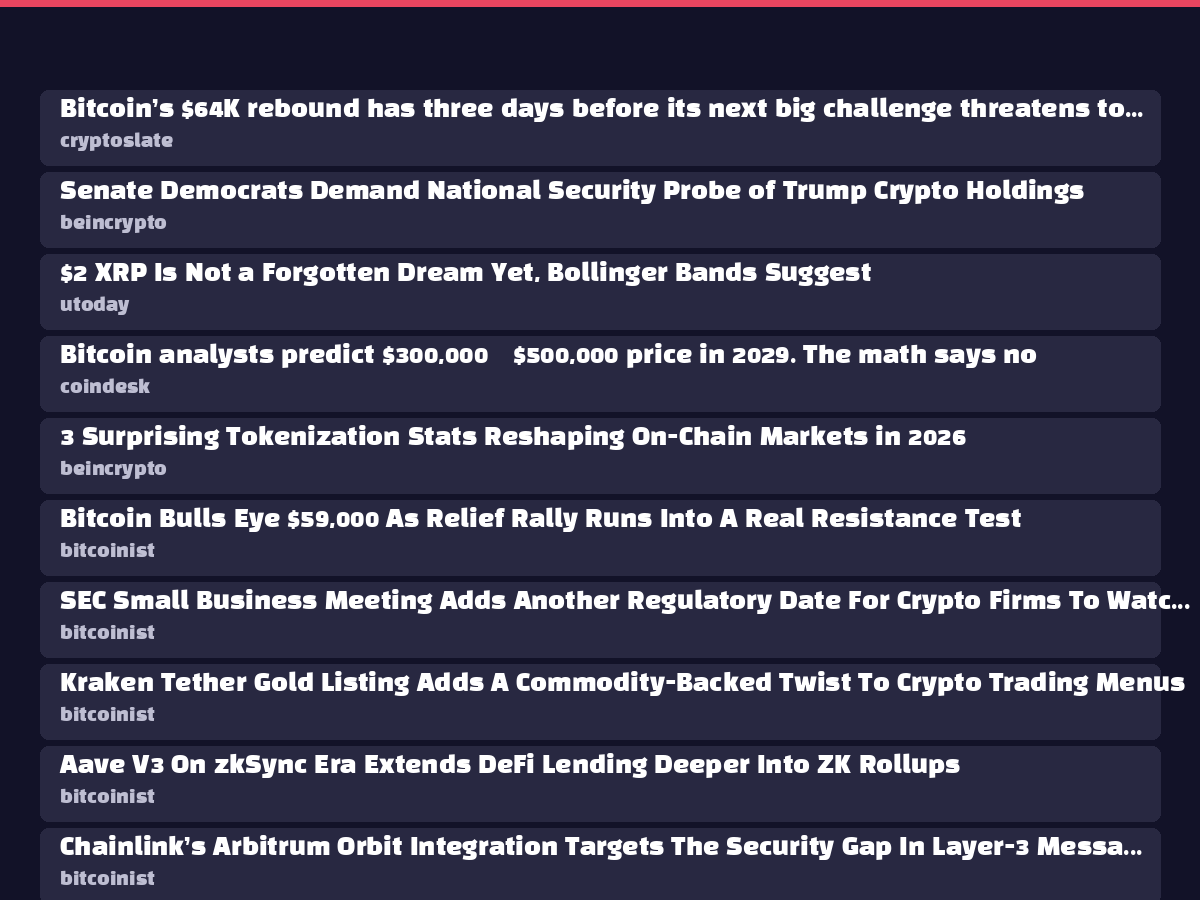
No major regulatory developments were confirmed in the collected news data. The XRP ETF market shows concerning outflow trends, with only XRPR recording a modest $0.2M inflow among six tracked funds. Notable outflows include XRP ETF at -$6.1M and XRPZ at -$2.9M, reflecting institutional investor sentiment weakness. This broad-based selling pressure across ETF products suggests cautious institutional positioning despite recent market stabilization.
5. 😱 Market Sentiment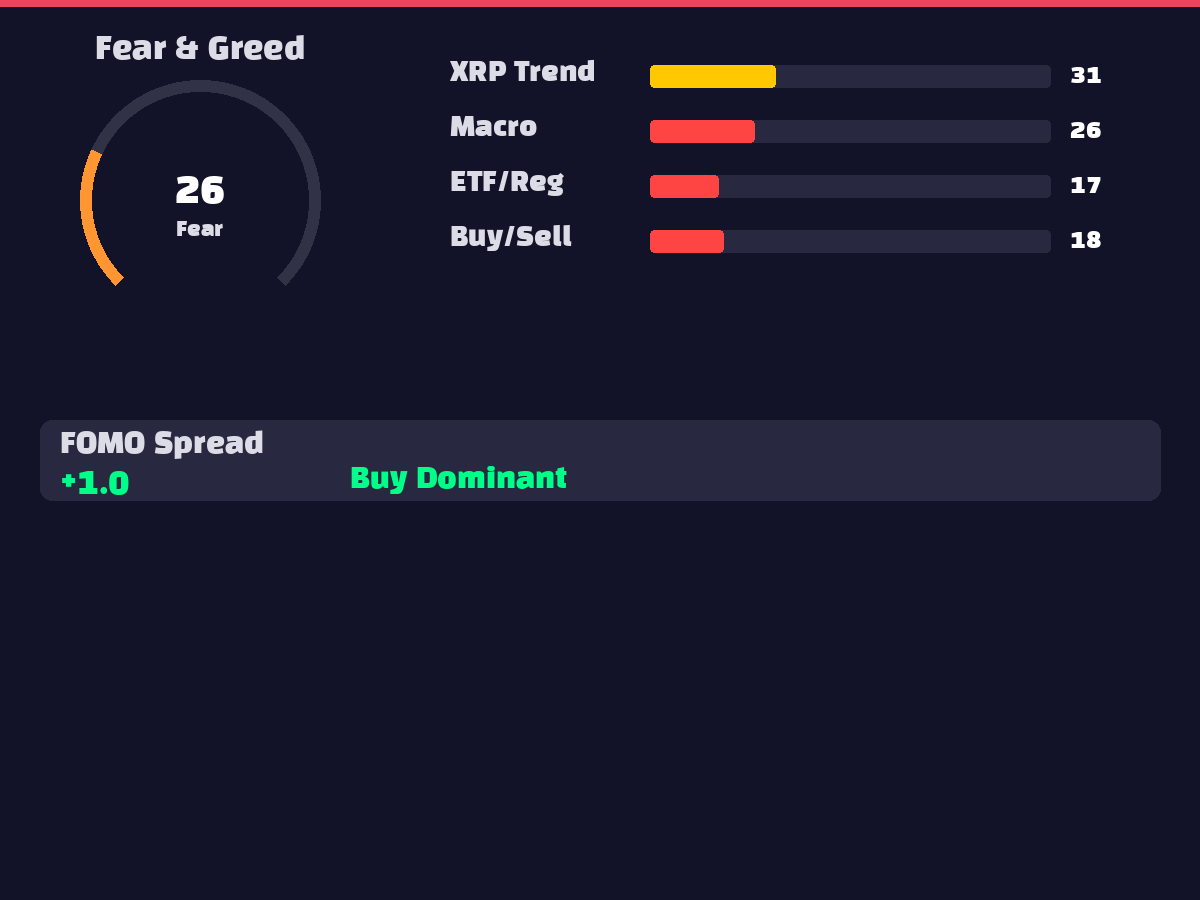
The Fear & Greed Index at 26 indicates extreme fear levels, reflecting conservative investor positioning. Search trends remain subdued with XRP at 31, macroeconomic trends at 26, and ETF/regulatory trends at 17, suggesting low retail engagement. The FOMO spread of 1.0 remains neutral, while the XRP/BTC interest ratio of 0.8889 shows declining relative interest versus Bitcoin. These metrics collectively suggest potential for contrarian recovery but lack of aggressive buying interest in the near term.
6. 🐋 On-Chain Activity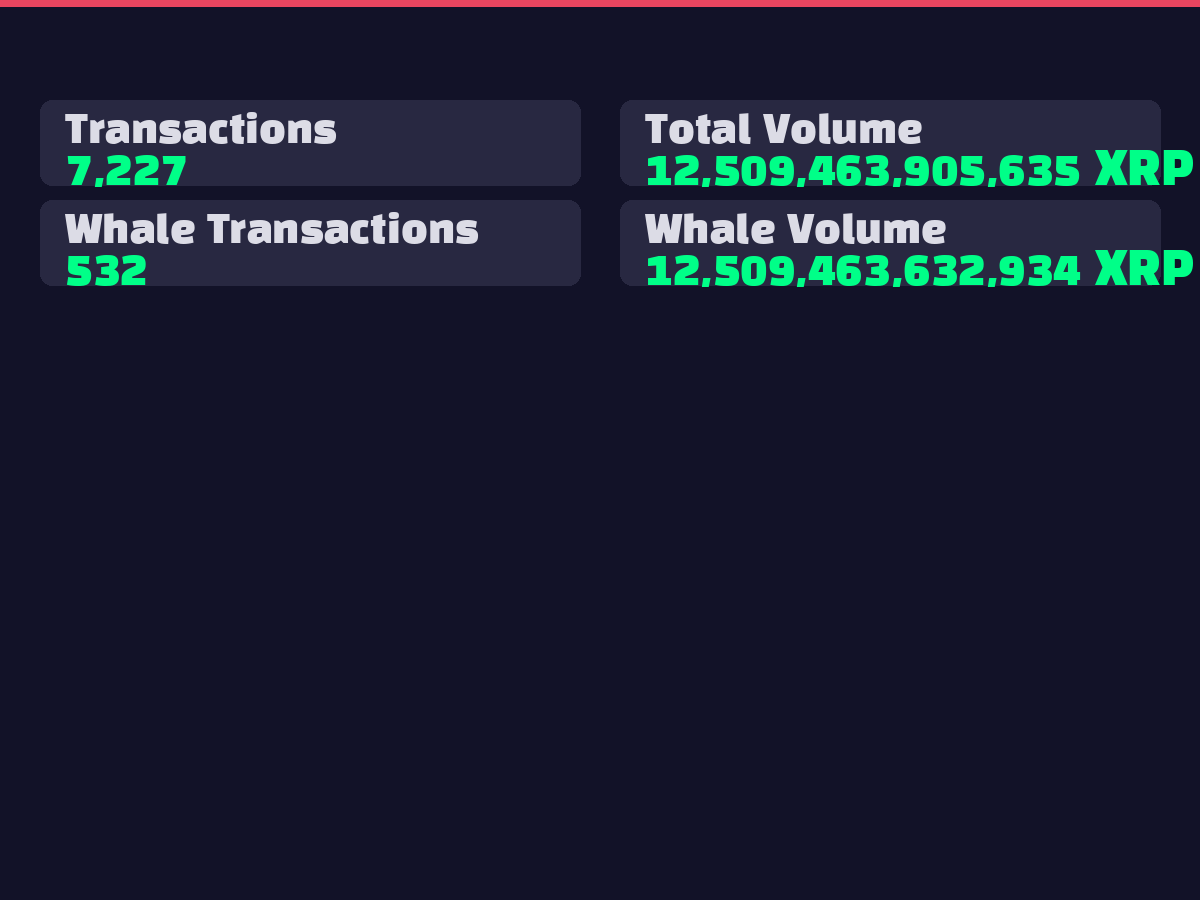
On-chain data reveals 7,227 total transactions with massive volume of 12.5 trillion XRP. Whale activity dominates with 532 large transactions accounting for virtually 100% of total volume at 12.5 trillion XRP. This concentration indicates active institutional and large investor repositioning, providing market liquidity while potentially increasing volatility. The whale dominance suggests retail participation remains minimal, with major players driving current market dynamics.
7. 📈 Elliott Wave / Wyckoff Analysis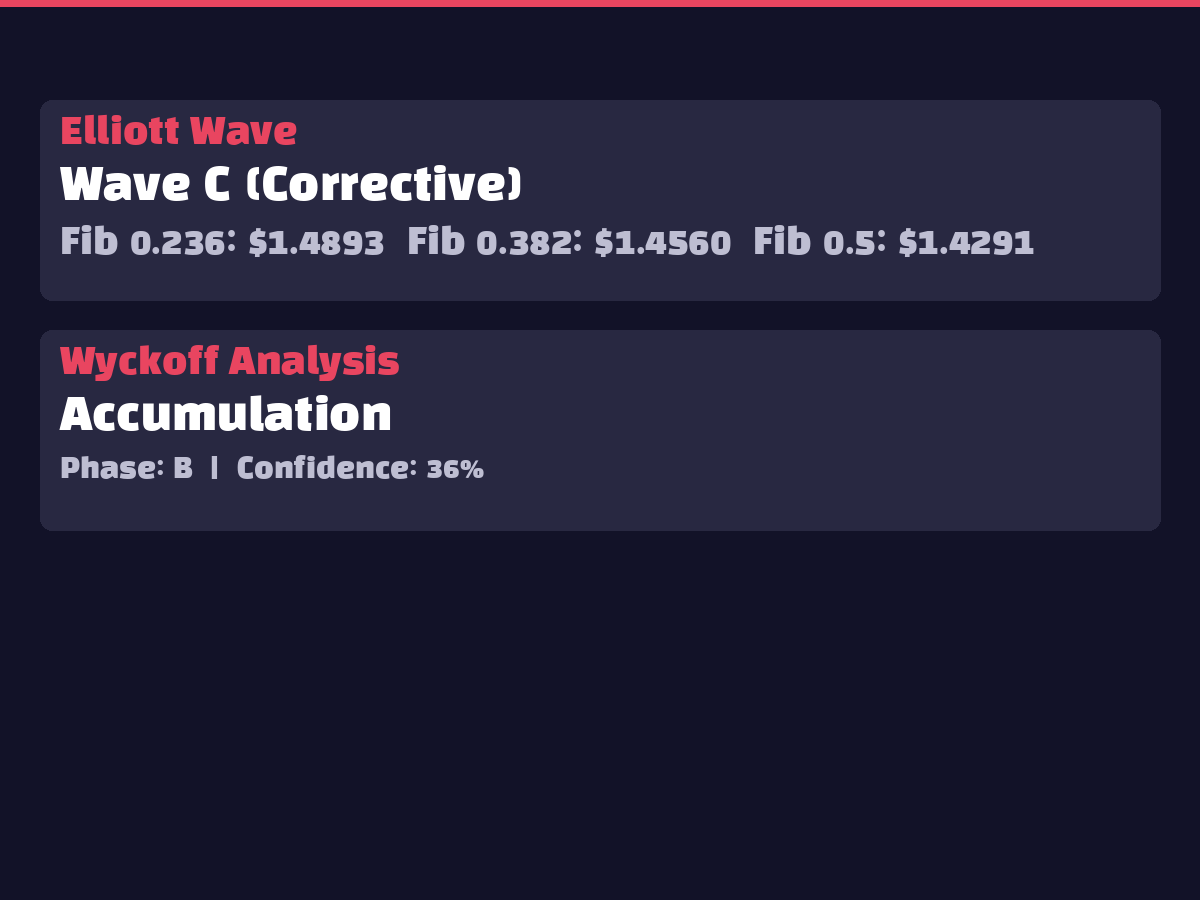
Elliott Wave analysis places XRP in Wave C of a corrective pattern, suggesting the downtrend may be nearing completion. Wyckoff methodology identifies an Accumulation phase at Stage B, though confidence remains low at 36%. This suggests potential bottom formation processes are underway but lack strong confirmation. Future completion of the accumulation phase could trigger upward momentum, though current conditions favor continued consolidation or minor corrections.
8. 🤖 AI Prediction Interpretation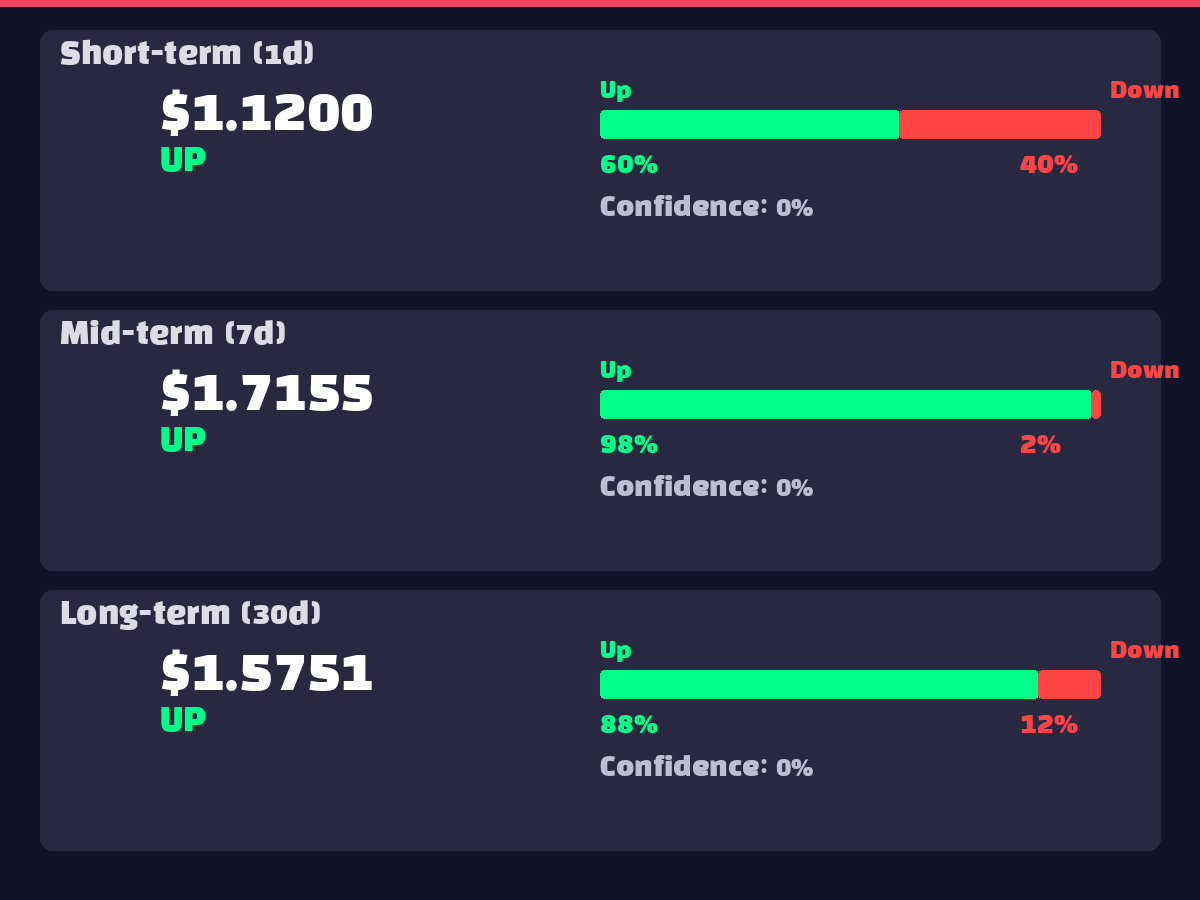
The ensemble AI model projects short-term (1-day) targets at $1.1200 with 59.8% upside probability, medium-term (7-day) at $1.7155 with 98.2% upside probability, and long-term (30-day) at $1.5751 with 87.8% upside probability. The 7-day prediction shows exceptional confidence in a 55% rally from current levels. However, the 30-day target below the 7-day suggests potential correction following medium-term gains. KRW targets of ₩2,559 (7-day) and ₩2,350 (30-day) represent substantial upside from current ₩1,652 levels.
9. ⚠️ Risk Factors
10. ✅ Overall Recommendation
Recommendation: Conditional Buy - Implementing a dollar-cost averaging strategy based on short-term recovery signals and medium-term AI model confidence.
Key Rationale:
Trading Strategy:
Risk management through position sizing and strict stop-loss adherence remains crucial given ETF outflow risks and whale trading concentration patterns.