XRP Market Analysis Report
Analysis Time: July 12, 2026, 16:09 (KST) / July 12, 2026, 07:09 (UTC)
1. 📌 Market Summary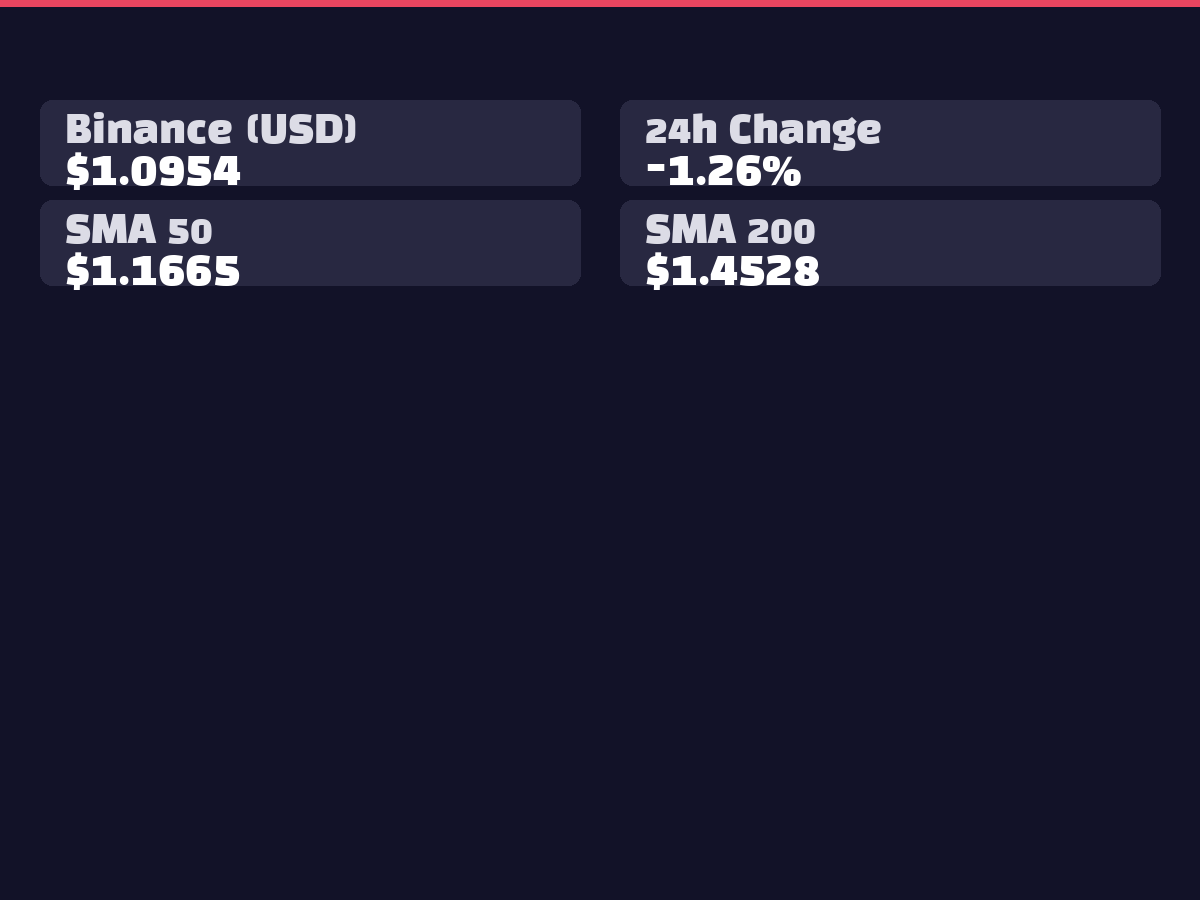
XRP is currently trading at $1.0926, showing a -1.34% decline over the past 24 hours. On Bithumb's KRW market, it recorded a slight drop of -1.21% at ₩1,631. The intraday trading range from a high of $1.1193 to a low of $1.0868 represents a relatively contained 2.9% volatility, with 24-hour volume reaching 42.4 million XRP. Currently consolidating near the Bollinger Band middle line ($1.0914), XRP is at a critical juncture for determining short-term directional movement.
2. 📊 Technical Analysis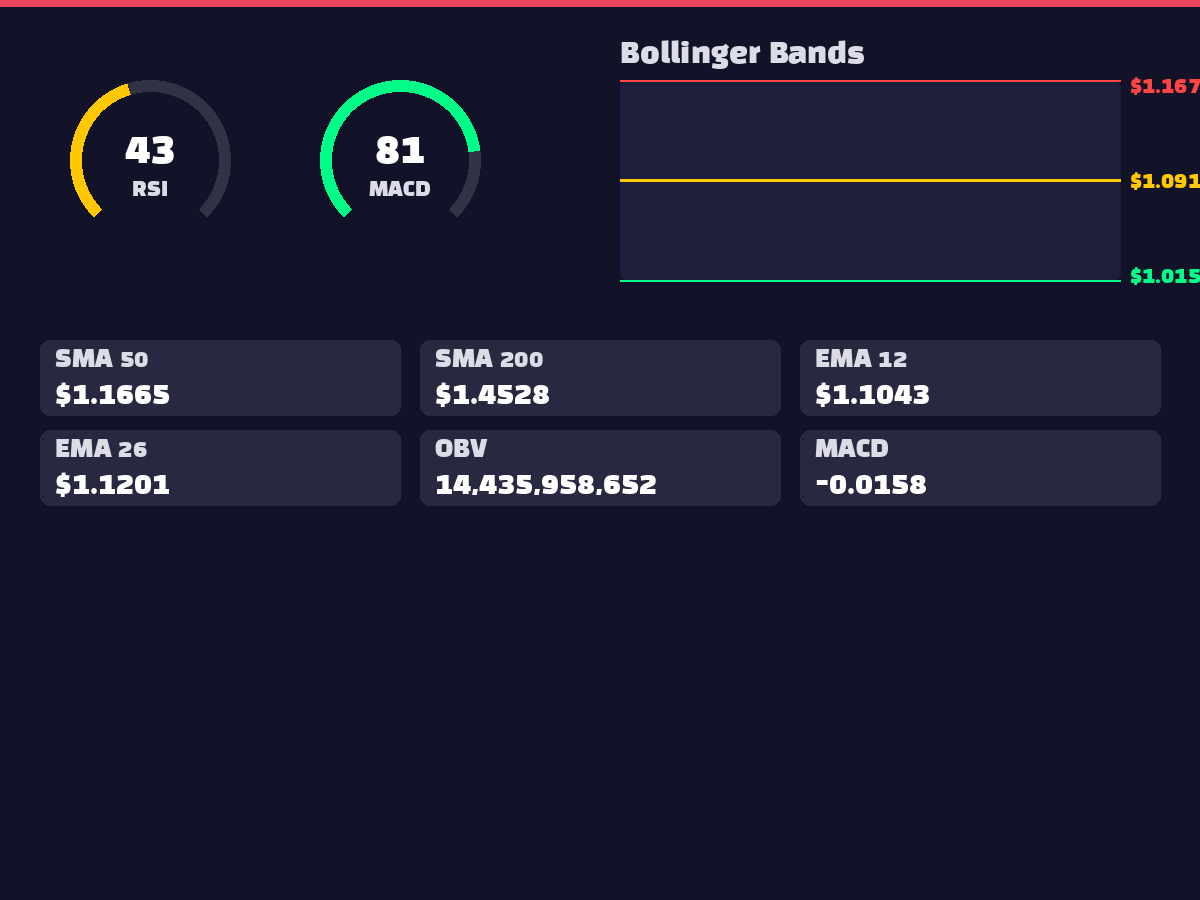
The RSI(14) at 43.96 sits in the lower neutral zone, suggesting potential oversold conditions ahead. MACD(-0.0158) is positioned above the signal line(-0.0220) with a positive histogram divergence of 0.0062, indicating emerging short-term reversal signals. Within the Bollinger Bands, the current price ($1.0926) hovers near the middle line ($1.0914), suggesting directional exploration. Moving average analysis shows the 5-day ($1.0984) and 20-day ($1.0914) lines closely aligned with current price, while significant gaps remain against the 50-day ($1.1665) and 200-day ($1.4528) lines with deviation rates of -6.30% and -24.76% respectively, indicating persistent medium to long-term downtrend. The OBV of 14.4 billion demonstrates substantial volume accumulation, while the EMA 12-day ($1.1043) remaining below the 26-day line ($1.1201) maintains short-term bearish structure.
3. 🌍 International Situation and Macroeconomic Environment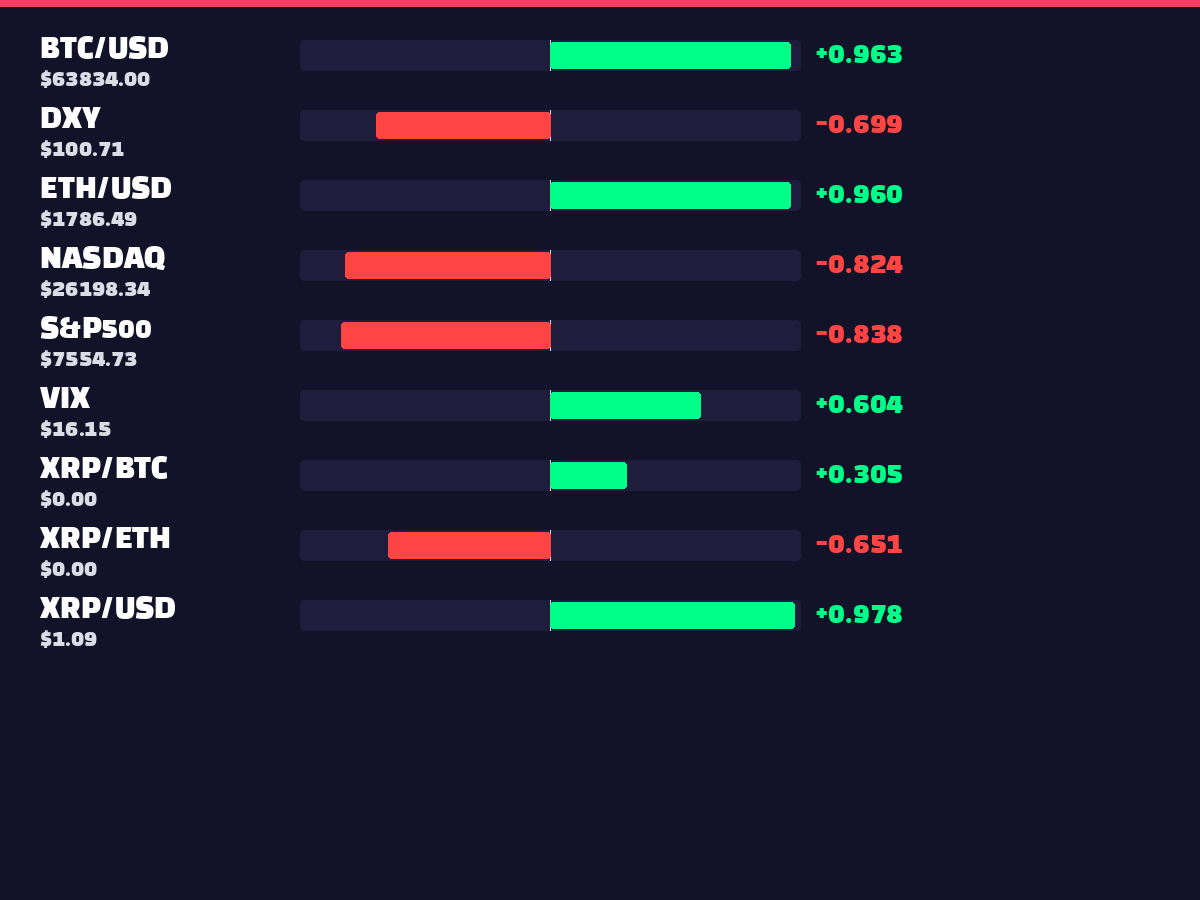
While specific international developments were not identified in the collected news, macroeconomic conditions can be assessed through correlation asset analysis. The -0.6995 inverse correlation with DXY ($100.7140) suggests XRP weakness during dollar strength. The 0.6040 positive correlation with VIX (16.15) implies potential XRP decline during market uncertainty escalation. Strong inverse correlations with S&P500 ($7,554.73) and NASDAQ ($26,198.34) at -0.8380 and -0.8236 respectively indicate concerns of fund outflows from cryptocurrencies during US equity market rallies. High positive correlations with BTC ($63,834) at 0.9630 and ETH ($1,786.49) at 0.9599 demonstrate continued synchronization across the broader cryptocurrency market.
4. ⚖️ Regulatory and Legal Environment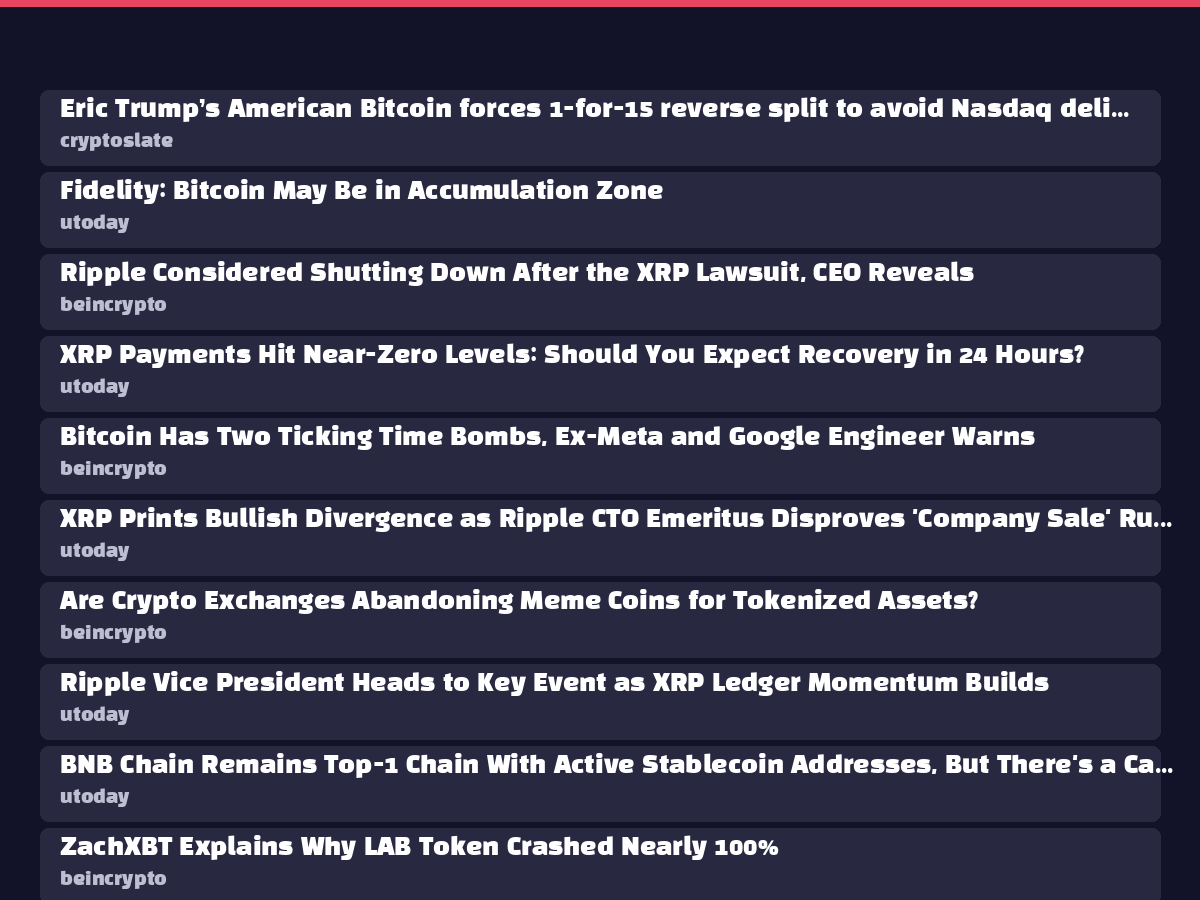
No major regulatory developments were identified in the currently collected news. However, XRP ETF markets show overall net outflow patterns, with XRPT(-$1.2M), XRPI(-$0.6M), XXRP(-$3.6M), XRPZ(-$2.9M), and XRP(-$6.1M) experiencing fund outflows. Only XRPR recorded net inflows of $0.2M, though the magnitude remains limited. The ETF/regulatory trend index of 14 represents a considerably low level, indicating insufficient regulatory-related interest or positive momentum at present.
5. 😱 Market Sentiment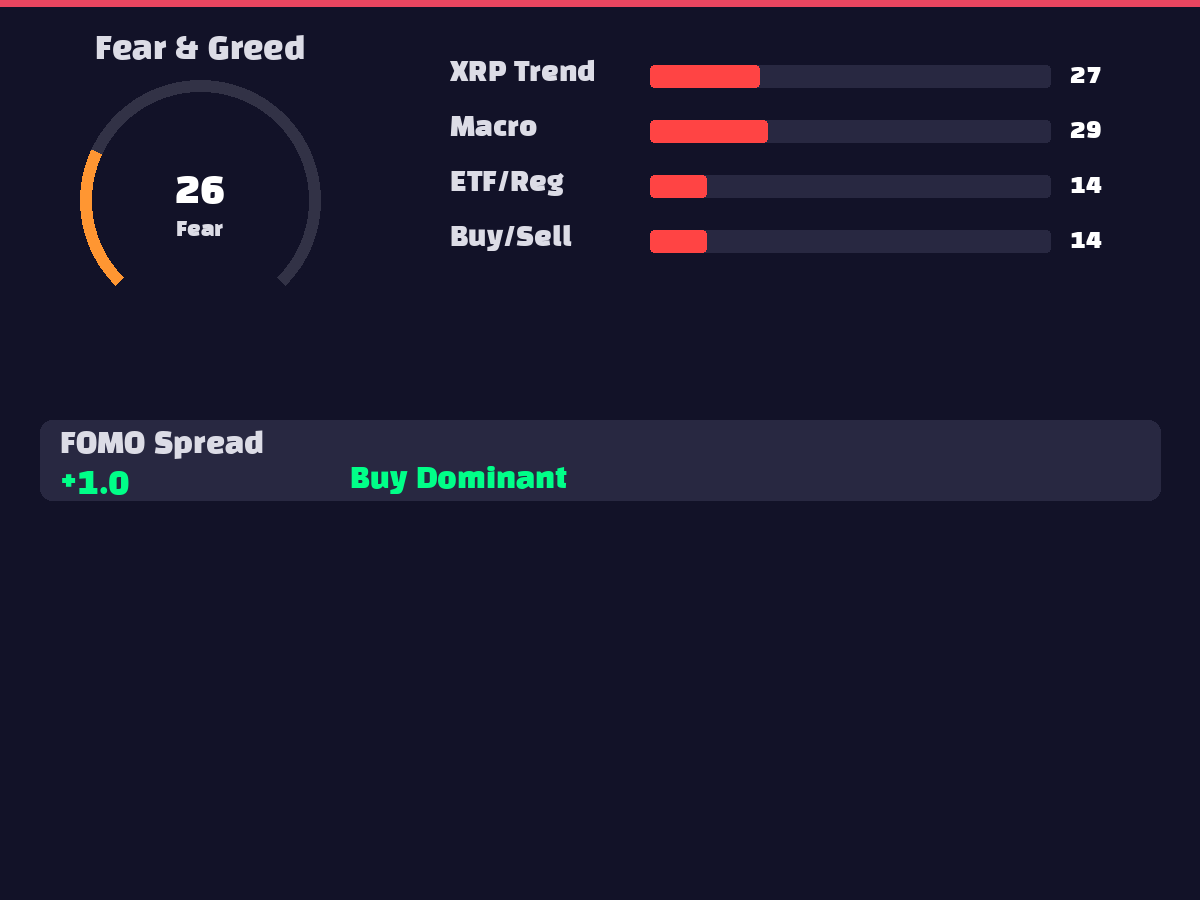
The Fear & Greed Index at 26 sits in extreme fear territory, reflecting pervasive negative sentiment among market participants. XRP search trends at 27 indicate significantly diminished public interest. The macroeconomic trend of 29 also remains subdued, suggesting continued concerns about economic uncertainty. The ETF/regulatory trend at 14 represents very low levels, indicating absent regulatory-related optimism. FOMO spread at 1.0 maintains neutral levels without rapid buying frenzies, while the XRP/BTC interest ratio of 0.9464 shows relatively high interest compared to Bitcoin. Overall market sentiment remains significantly contracted, requiring positive catalysts for reversal.
6. 🐋 On-Chain Activity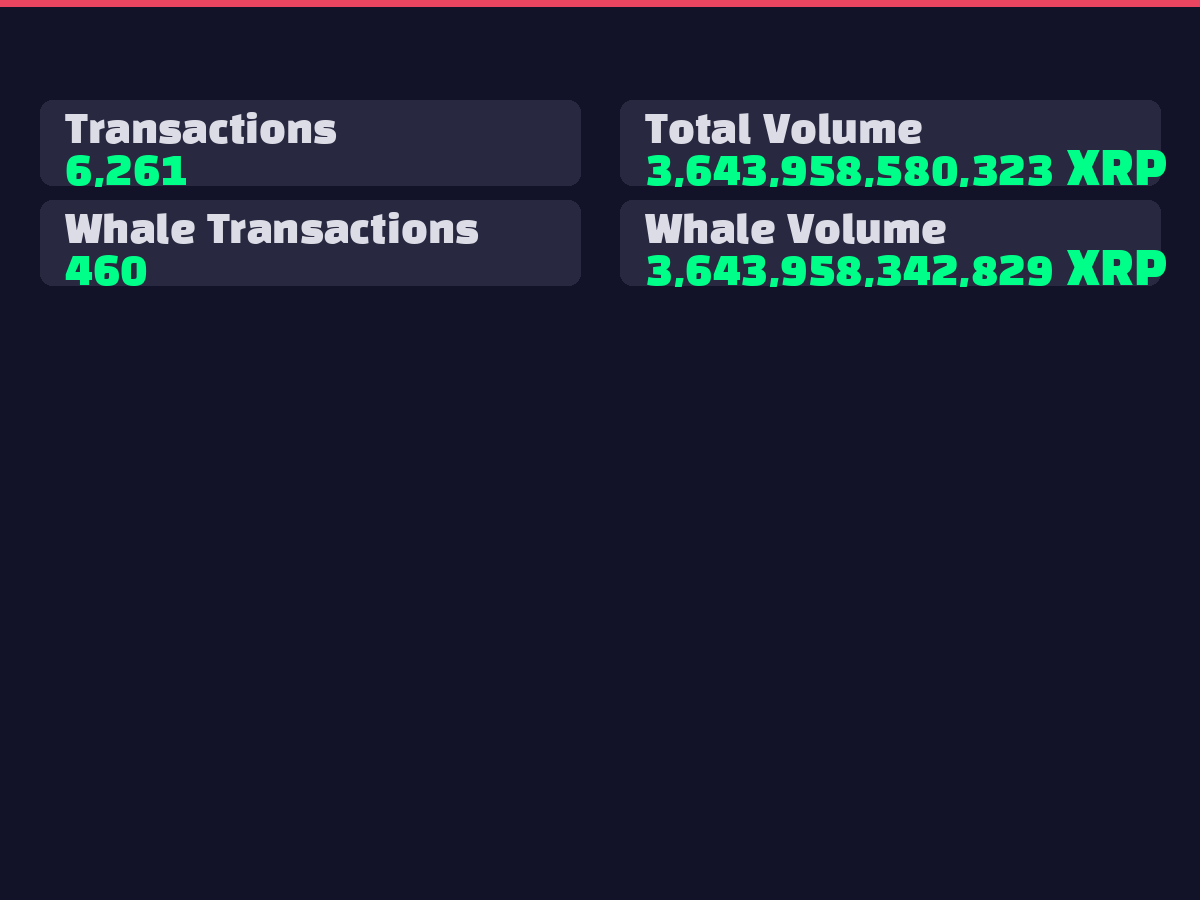
On-chain data reveals 6,261 total transactions with aggregate volume reaching 3.64 trillion XRP. Whale transactions numbered 460 accounts for 3.64 trillion XRP (nearly 100% of total volume), demonstrating active large investor movements. This suggests active position adjustments by institutional investors or major holders, representing meaningful trading activity at current price levels. Concentrated whale trading increases potential for future volatility expansion, while the high whale participation rate relative to total volume indicates market leadership remains with large investors.
7. 📈 Elliott Wave / Wyckoff Analysis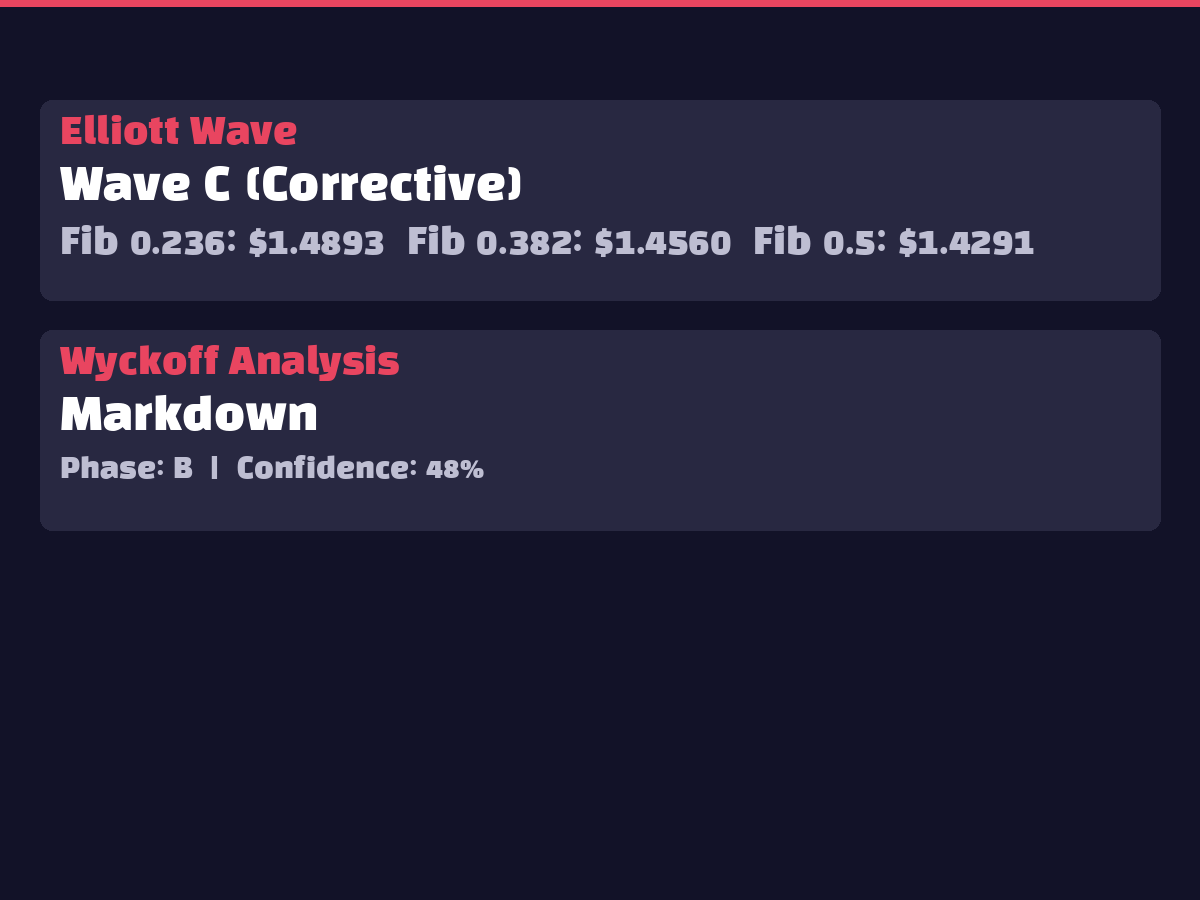
Elliott Wave analysis places the current position in Wave C corrective phase. Wave C typically represents the final stage of corrective waves, implying potential for new upward waves after completion of downward pressure. Wyckoff analysis shows the Markdown phase at Stage B with 48% confidence level. The Markdown phase represents the price decline process after distribution completion, with current Stage B indicating temporary rebounds or sideways movement during the decline process. Entry into Stage C could expect additional declines, though the possibility of transitioning to a new accumulation phase cannot be ruled out if Spring (rapid recovery after sharp decline) occurs. Both analyses suggest positioning in the latter half of the correction process.
8. 🤖 AI Prediction Results Interpretation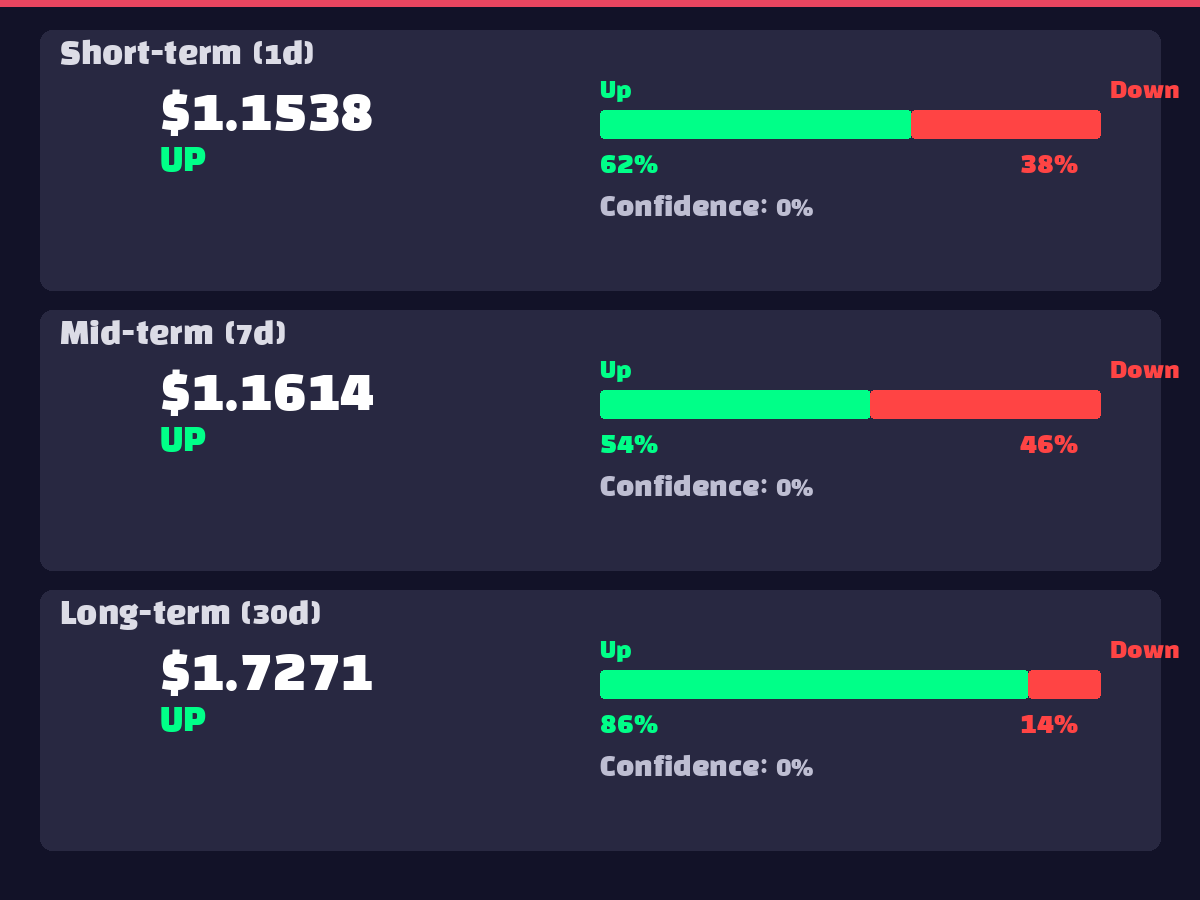
AI ensemble model predictions forecast gradual upward progression across timeframes. Short-term (1-day) prediction of $1.1538 (₩1,722) suggests 5.6% upside from current levels with 62.2% probability. Medium-term (7-day) prediction of $1.1614 (₩1,734) anticipates 6.3% gains, though probability decreases to 54.1%, indicating increased uncertainty. Long-term (30-day) forecasts project $1.7271 (₩2,578) representing a robust 58% advance with high 85.8% probability confidence. The pattern of declining probability from short to medium-term before surging in long-term suggests current correction completion followed by genuine upward cycle entry. However, limited short-term upside potential and elevated medium-term uncertainty require cautious approaches.
9. ⚠️ Risk Factors
10. ✅ Overall Recommendation
Recommendation: Partial Buy (Staged Dollar-Cost Averaging)
XRP currently displays both correction completion signals and medium-to-long-term upside potential, warranting cautious partial accumulation.
Key Supporting Factors:
Trading Strategy:
For risk management, recommend initial entry with only 30-50% of total intended investment, with additional purchases following technical confirmation.