XRP Market Analysis Report
Analysis Time: July 13, 2026, 16:09 (KST) / July 13, 2026, 07:09 (UTC)
1. 📌 Market Summary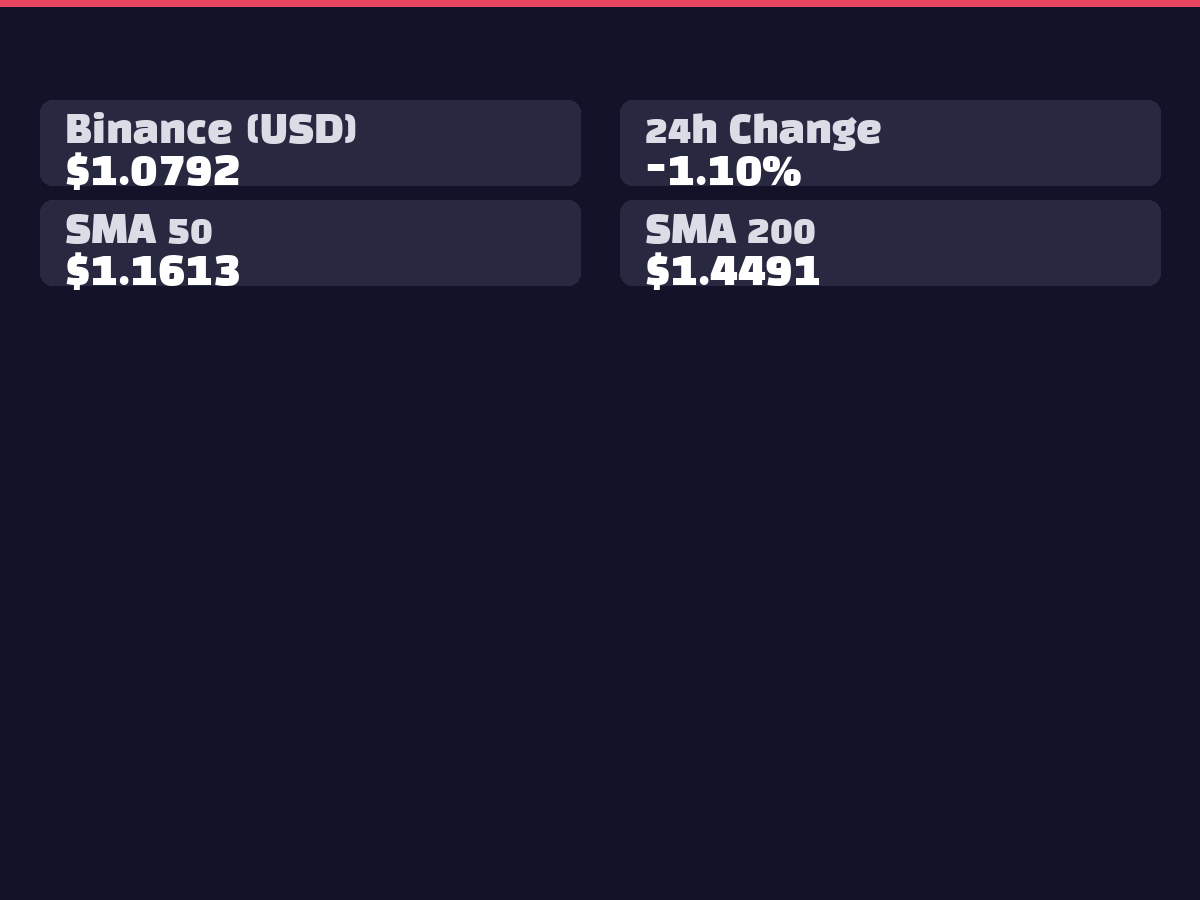
XRP is currently trading at $1.0796, showing a modest decline of -1.19% over 24 hours. Trading volume remains robust at 49.2 million XRP on Binance, with intraday movements ranging from a high of $1.1043 to a low of $1.0674. The Bithumb KRW price stands at ₩1,603, down -1.72%, showing similar directional movement to the USD pair. AI prediction models present bullish scenarios across all timeframes from short to long-term, suggesting the current correction could be interpreted as a buying opportunity.
2. 📊 Technical Analysis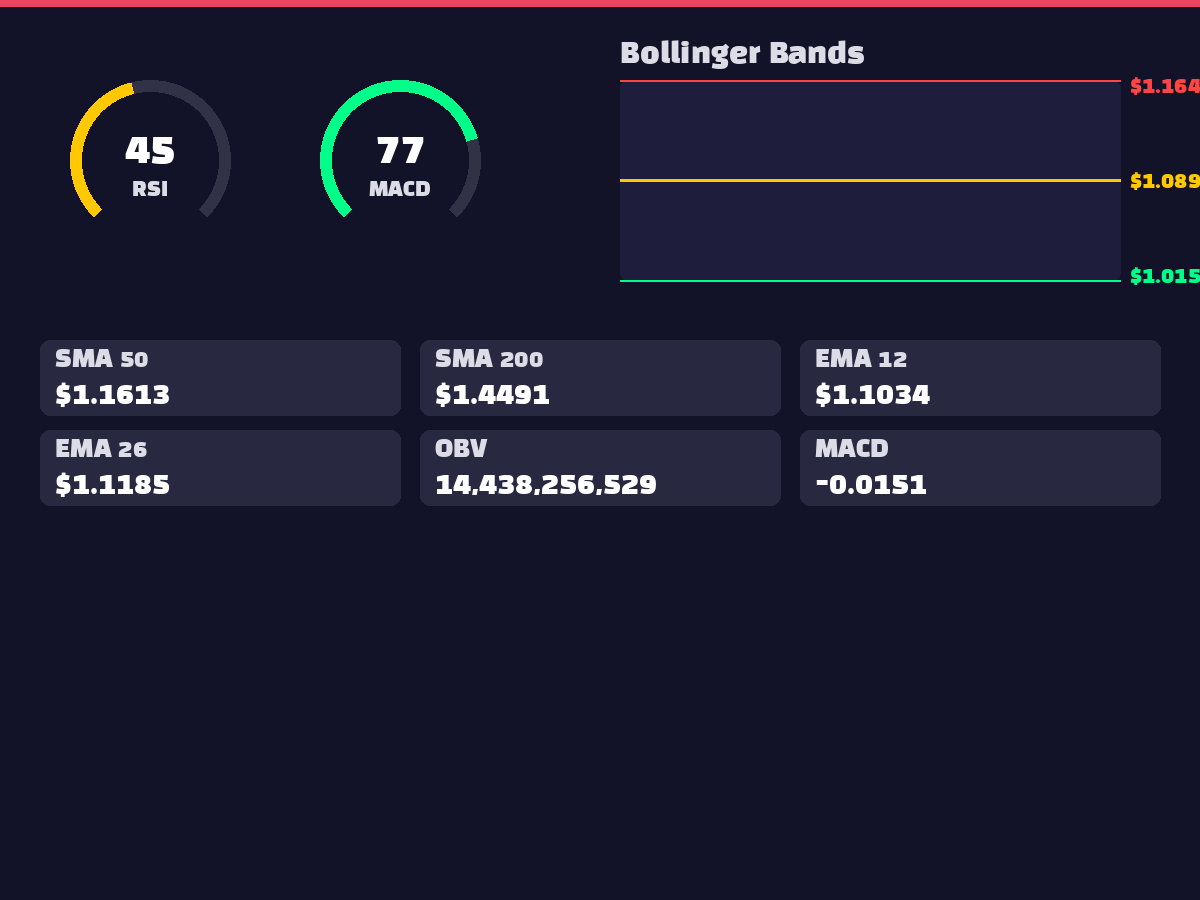
The RSI(14) at 45.17 remains in neutral territory, showing no overbought or oversold signals. MACD(-0.0151) above signal(-0.0206) with positive histogram(0.0055) indicates recovering upward momentum. Price action near the Bollinger Bands middle line(1.0899) suggests a period of consolidating volatility. Moving average analysis shows support above the 5-day(1.0954) and 20-day(1.0899) lines, though significant gaps remain to the 50-day(1.1613) and 200-day(1.4491) averages. The -24.21% deviation from the 200-day moving average particularly suggests substantial upside potential. OBV at 14.4 billion indicates sustained volume-based upward momentum.
3. 🌍 International Situation & Macroeconomics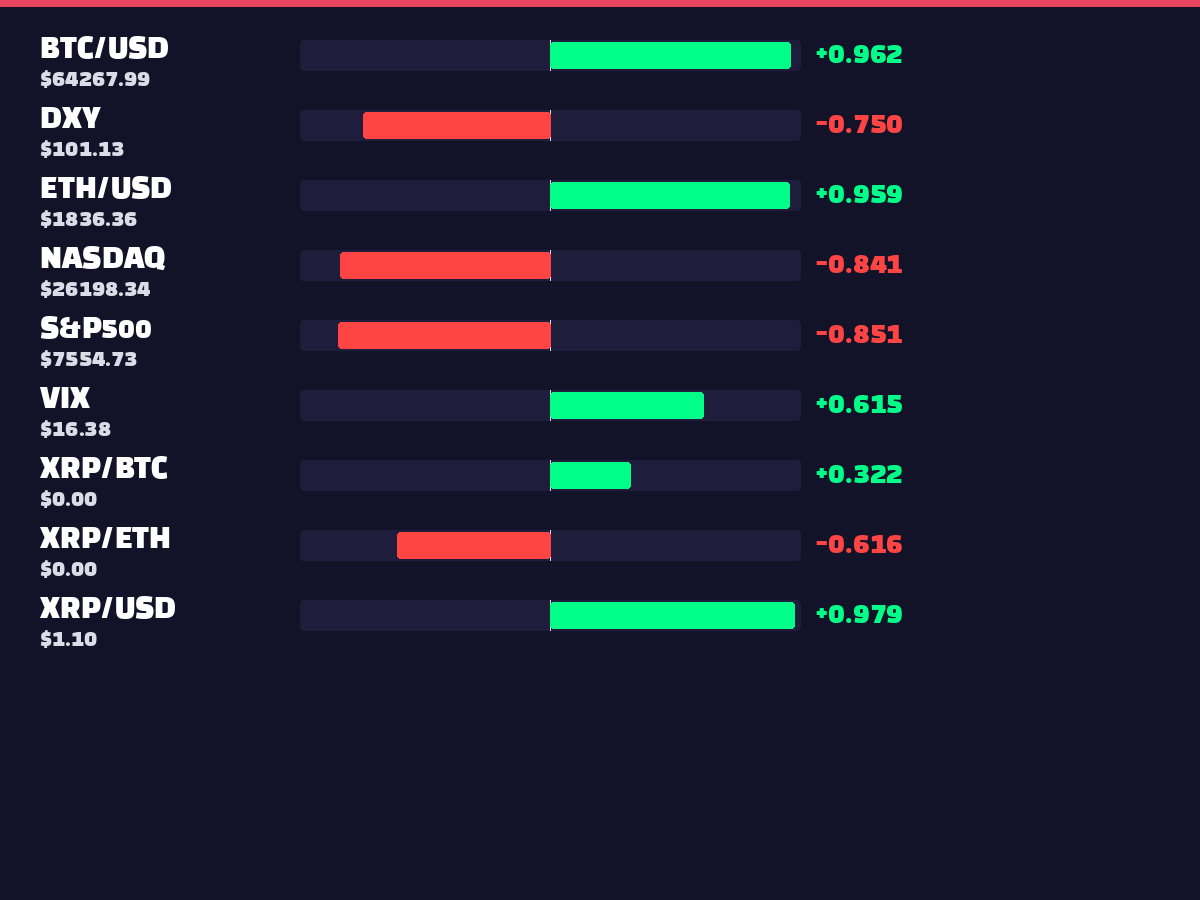
No direct international situation changes have been identified from currently collected news. However, correlation analysis reveals macroeconomic influences. The negative correlation of -0.7504 with DXY at 101.13 suggests XRP tends to rise when the dollar weakens. Strong negative correlations with S&P500(7554.73) at -0.8507 and NASDAQ(26198.34) at -0.8405 indicate opposite directional movements to equity markets. The relatively low VIX at 16.15 with a positive correlation of 0.6252 suggests XRP may rise alongside increasing volatility.
4. ⚖️ Regulatory & Legal Environment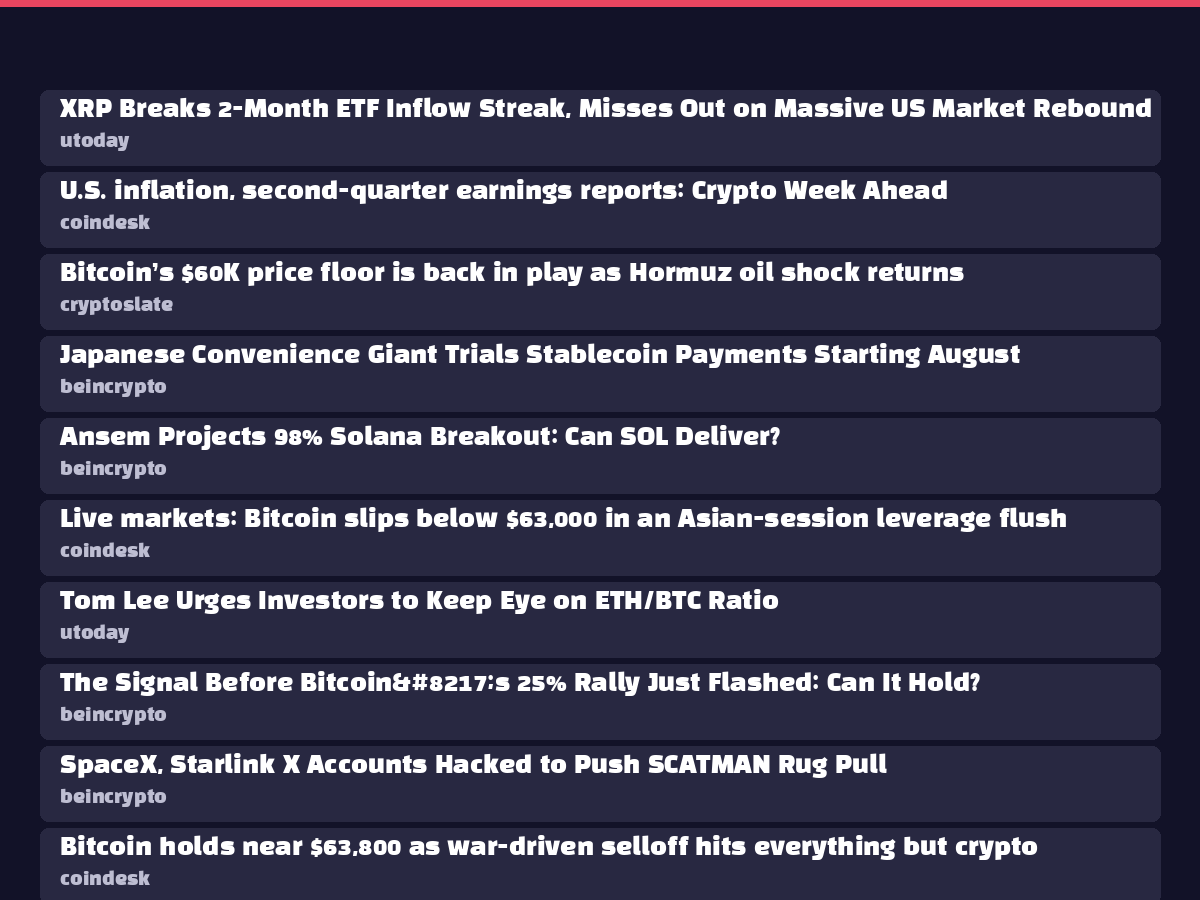
No major regulatory changes have been confirmed from currently collected news. XRP ETF activity shows overall net outflows of -$8.2M, though XRPR recorded a positive inflow of $0.2M. Trading volumes are led by XRP(496,452), XRPZ(243,353), and XXRP(158,083), demonstrating continued institutional interest. The regulatory search trend at 20 is relatively low, suggesting no particular regulatory issues are currently prominent.
5. 😱 Market Sentiment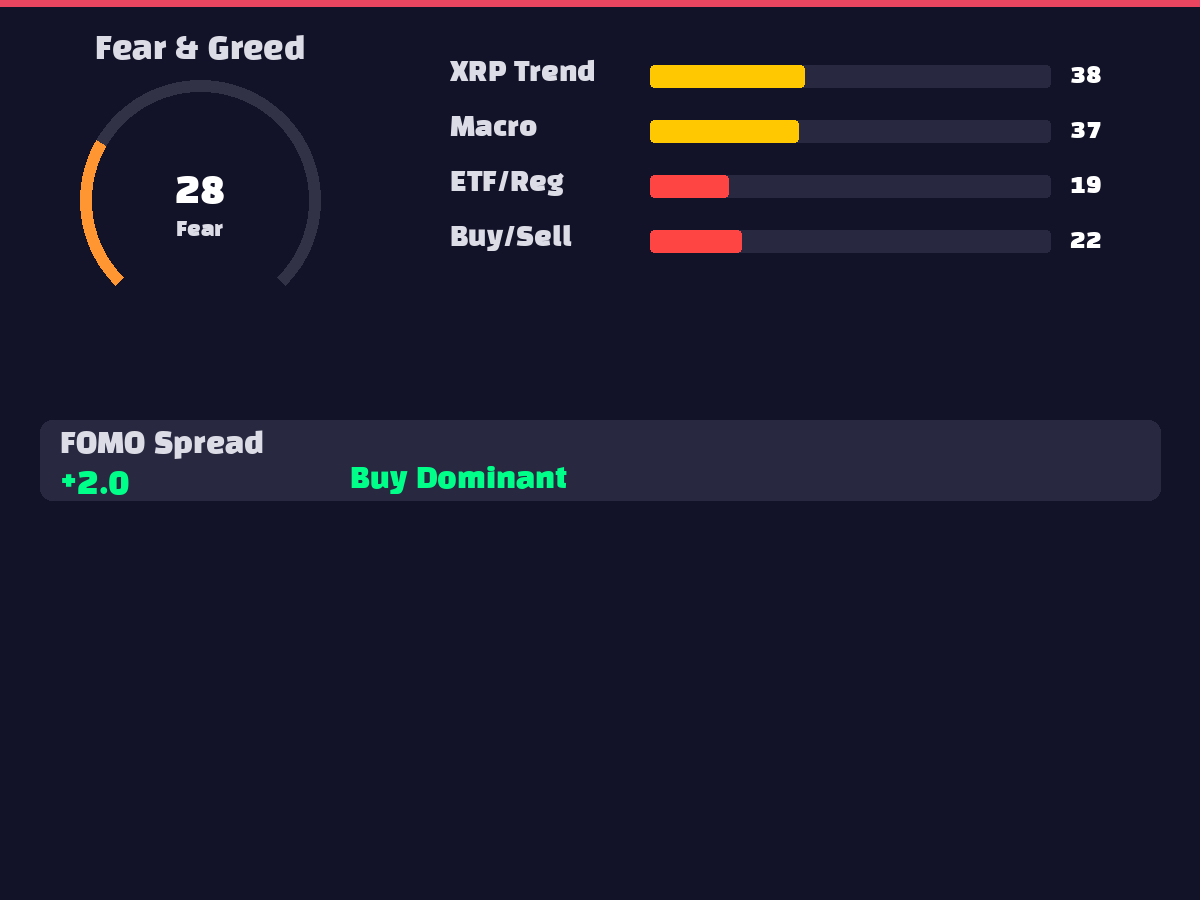
The Fear & Greed Index at 28 places the market in "fear" territory, indicating excessive pessimism. XRP search trends at 39 represent moderate levels, showing appropriate public interest. Combining macroeconomic trends at 37 with ETF/regulatory trends at 20 suggests investors show some interest in macroeconomic factors while regulatory concerns remain low. FOMO spread at 2.0 indicates no excessive buying frenzy, maintaining healthy levels. The XRP/BTC interest ratio of 0.8202 suggests relatively high interest in XRP compared to Bitcoin, indicating independent upward momentum potential.
6. 🐋 On-Chain Activity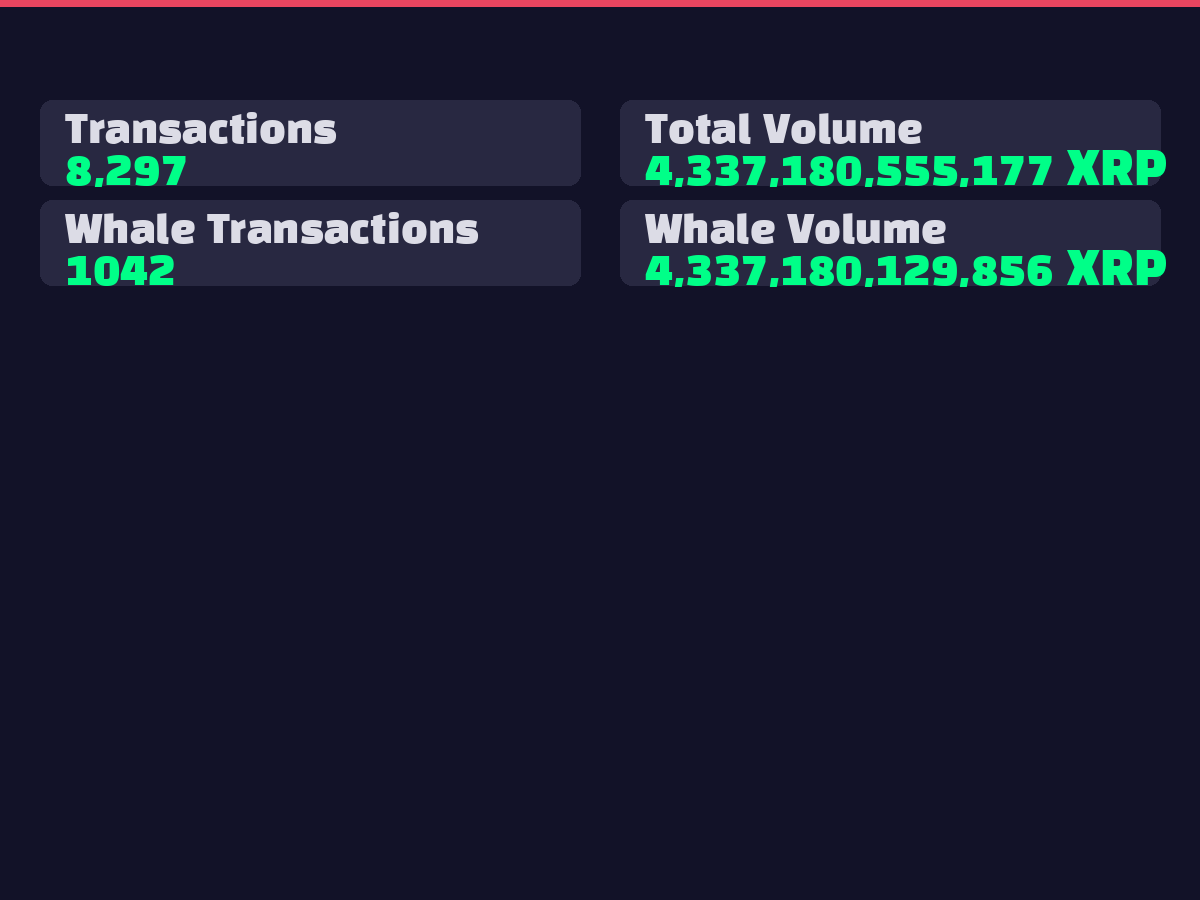
A total of 8,297 transactions occurred with overall trading volume reaching 4.337 trillion XRP. Notably, whale transactions numbered 1,042 trades accounting for most of the 4.337 trillion XRP volume, showing active large investor movements. This suggests institutions and large investors are actively adjusting positions at current price levels. The fact that whale transactions represent nearly 100% of total volume indicates institution-driven rather than retail-driven trading patterns, meaning institutional investor intentions will be crucial variables for future price movements.
7. 📈 Elliott Wave / Wyckoff Analysis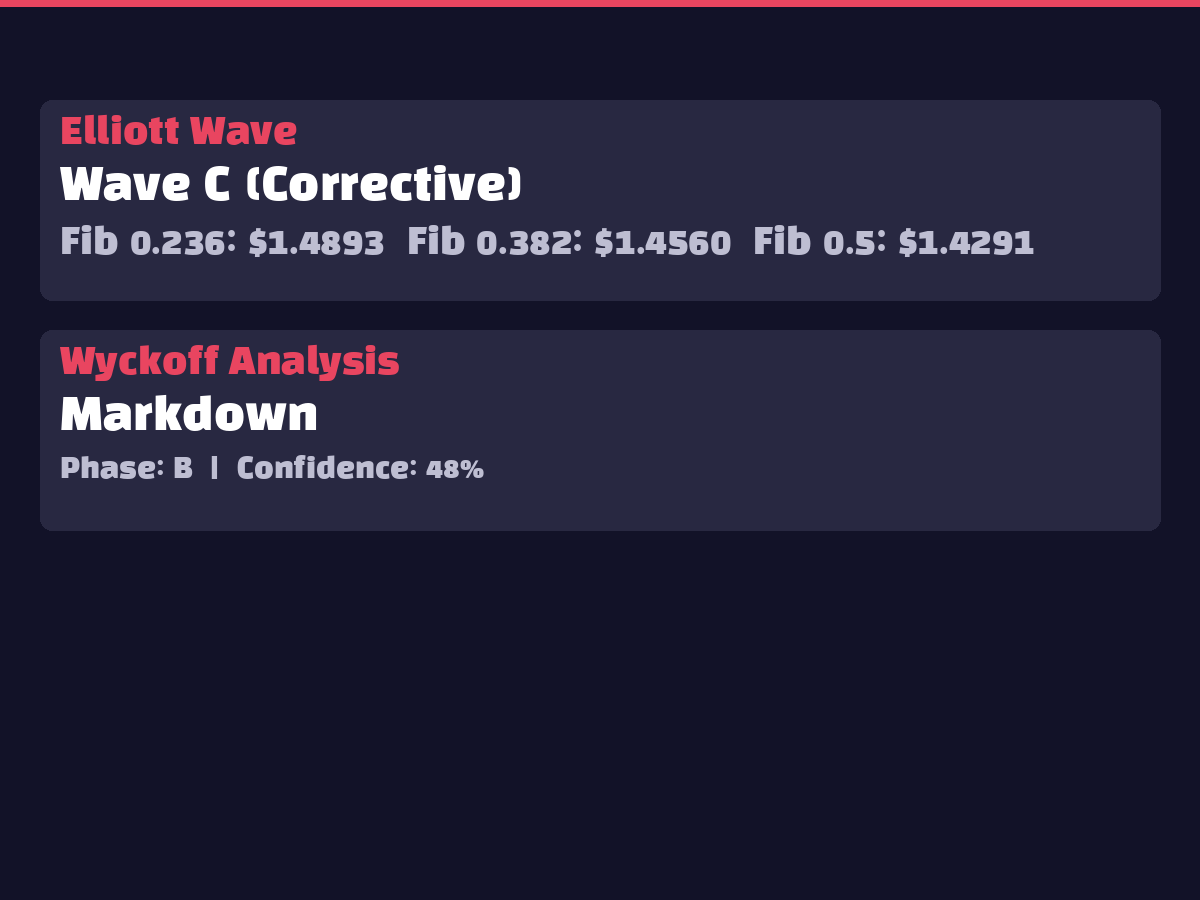
Elliott Wave analysis places the current position in Wave C (corrective), suggesting the downward correction may be nearing completion. Wyckoff analysis classifies this as Phase B of the Markdown stage with 48% confidence. While the Markdown stage typically indicates price decline and distribution, Phase B within this stage presents potential for rebounds. The combination of Elliott Wave C completion and Wyckoff Phase B suggests the current correction may be finishing, potentially transitioning to a new upward cycle.
8. 🤖 AI Prediction Results Interpretation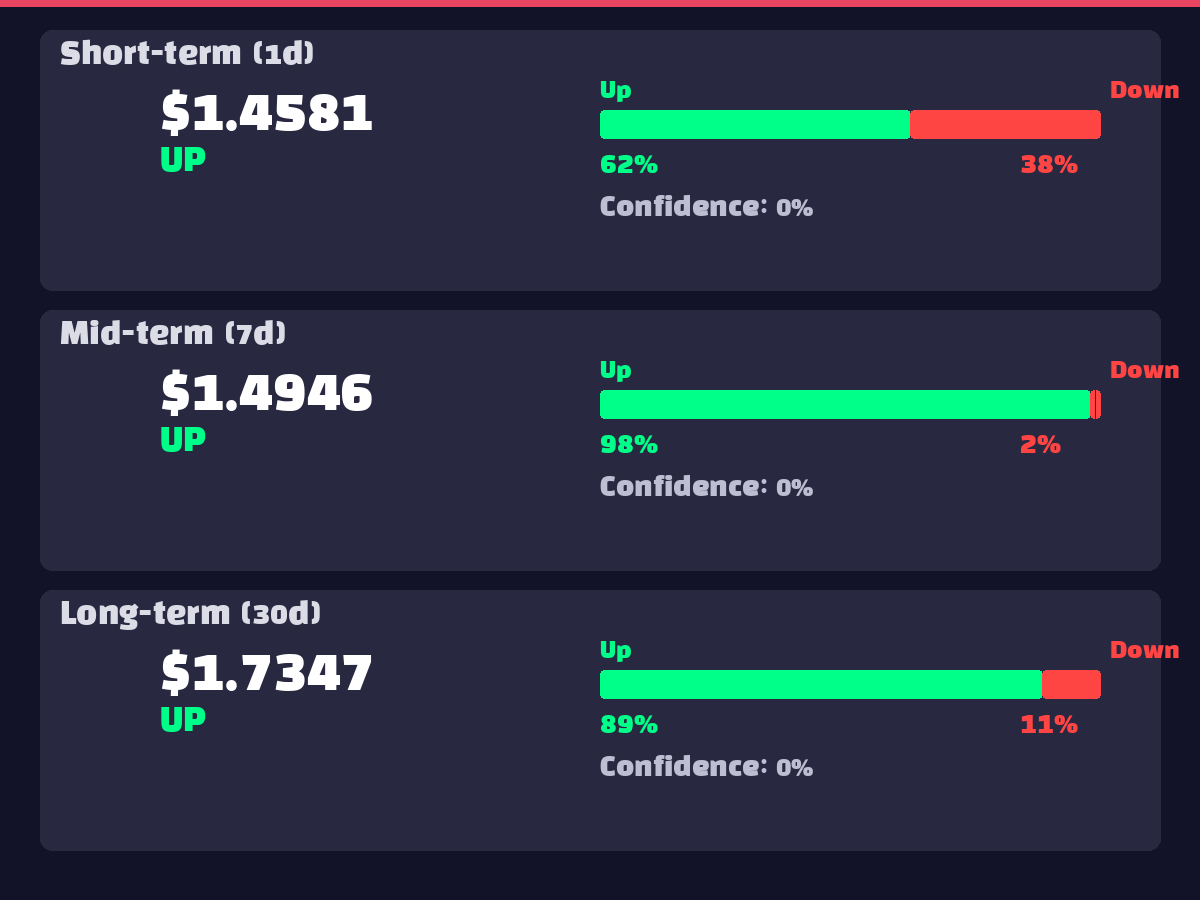
AI ensemble models present strong bullish signals across all timeframes. Short-term (1-day) prediction of $1.4581 (62.1% upward probability) implies a 35% gain from current levels, while medium-term (7-day) $1.4946 (98.1% upward probability) suggests a 38% increase. Long-term (30-day) $1.7347 (88.5% upward probability) presents the highest target with a 61% gain. The 98.1% upward probability for medium-term predictions shows exceptionally high confidence, suggesting the current correction may be a precursor to strong rebounds. In KRW terms, short-term ₩2,165, medium-term ₩2,219, and long-term ₩2,576 show substantial upside potential from the current Bithumb price of ₩1,603.
9. ⚠️ Risk Factors
10. ✅ Comprehensive Opinion
Recommendation: BUY - Strong AI upward signals combined with technical analysis indicating correction completion stages warrant gradual accumulation.
Key Rationale:
Specific Strategy:
Despite current fear sentiment and ETF outflows, AI models and technical indicators present strong rebound signals, recommending gradual entry through dollar-cost averaging.