XRP Market Analysis Report
Analysis Time: July 19, 2026 16:09 (KST) / 2026-07-19 07:09 (UTC)
1. 📌 Market Summary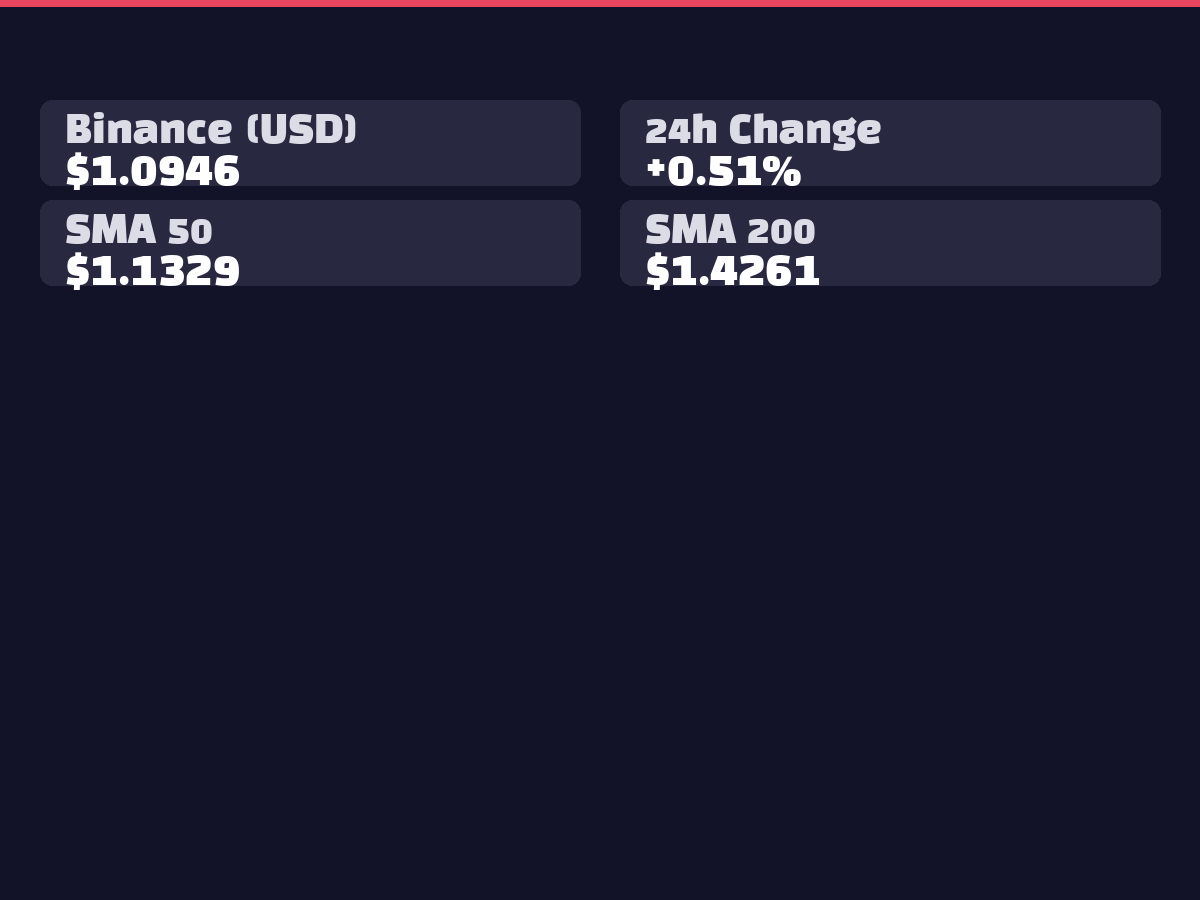
XRP is currently trading at $1.0964, recording a modest gain of +0.73% over the past 24 hours. On Bithumb, it trades at ₩1,612 with a 24-hour change of 0.25%. Technical indicators show RSI at 46.18 and MACD histogram turning positive at 0.0031, signaling potential short-term momentum recovery. XRP ETFs collectively recorded $12.3M in net inflows, indicating continued institutional capital influx into the asset.
2. 📊 Technical Analysis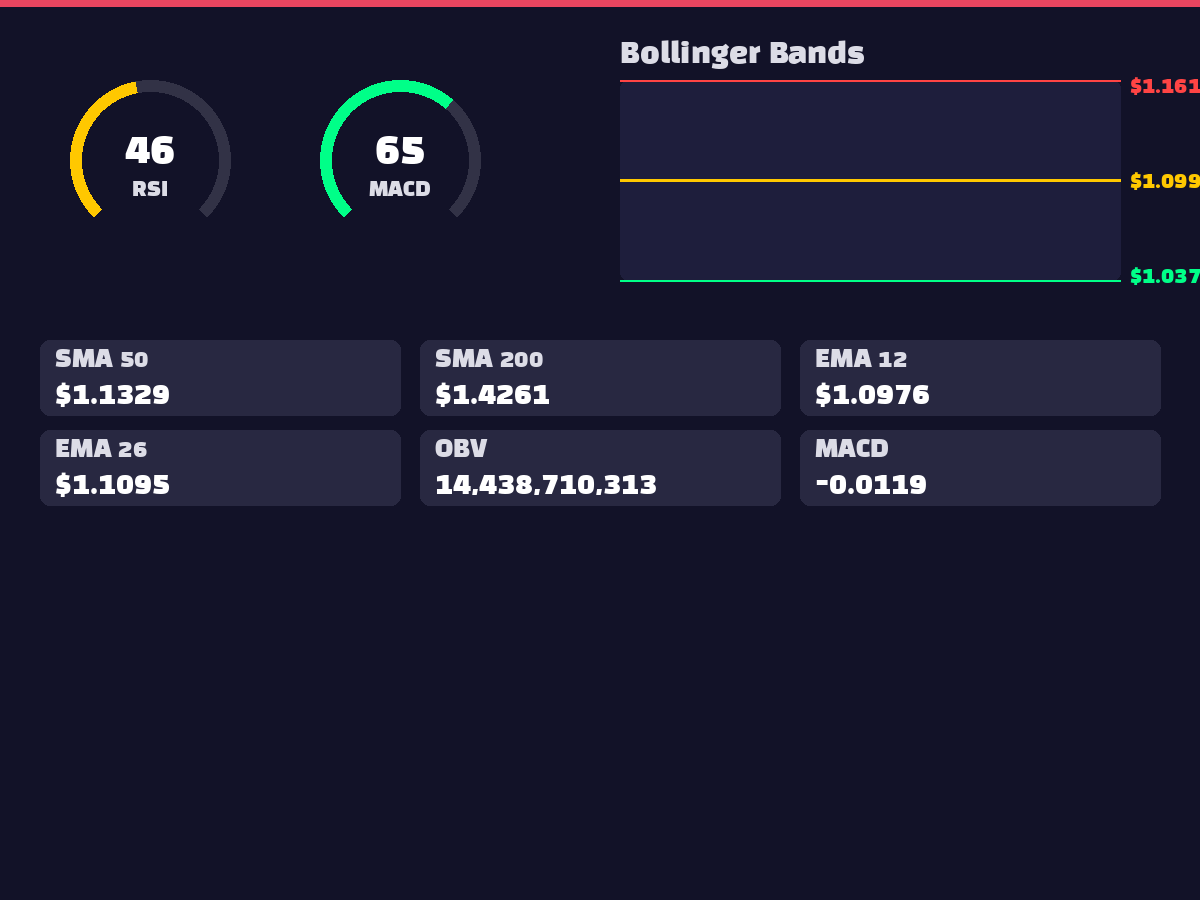
RSI at 46.18 positions in neutral territory near oversold levels, suggesting rebound potential. MACD at -0.0119 has moved above the signal line at -0.0150, with the histogram turning positive at 0.0031, indicating emerging short-term upward momentum. Within the Bollinger Bands, the current price finds support near the middle band (1.0994), with approximately 6% upside room to the upper band (1.1618). Moving average analysis reveals deviations of -3.45% and -23.30% from the 50-day (1.1329) and 200-day (1.4261) lines respectively, indicating substantial recovery potential from medium to long-term perspectives. OBV at 14,438,710,313 suggests sustained volume-based buying pressure.
3. 🌍 International Affairs and Macroeconomic Environment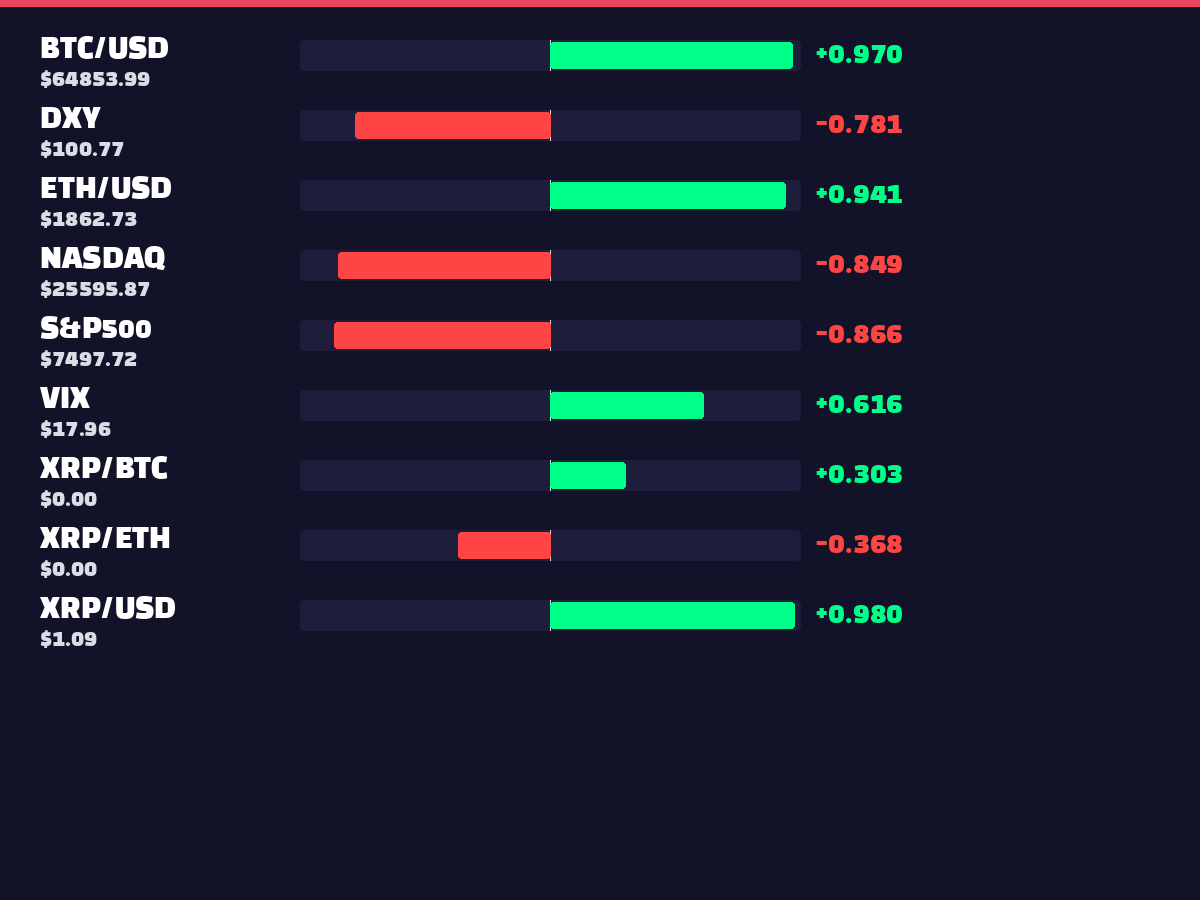
No significant international developments were identified in current news feeds. Correlation analysis shows a -0.7812 negative correlation with DXY, suggesting XRP benefits from dollar weakness. Strong negative correlations with S&P500 (-0.8661) and NASDAQ (-0.8487), along with a positive correlation of 0.6158 with VIX, characterize XRP as a risk asset. The current VIX level of 17.96 indicates limited market anxiety.
4. ⚖️ Regulatory and Legal Environment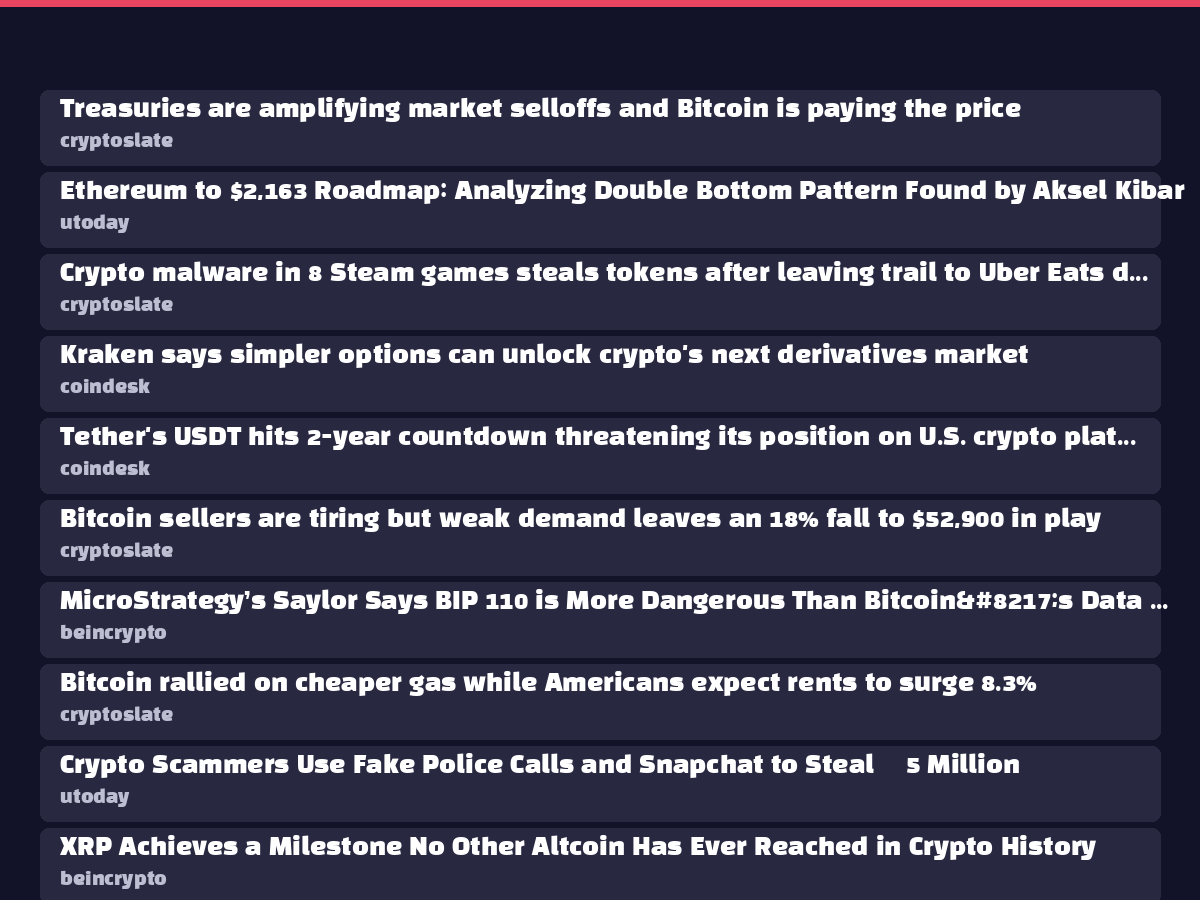
No major regulatory changes were identified in current news sources. XRP ETF products are trading normally with total net inflows of $12.3M, demonstrating a stable regulatory environment.
5. 😱 Market Sentiment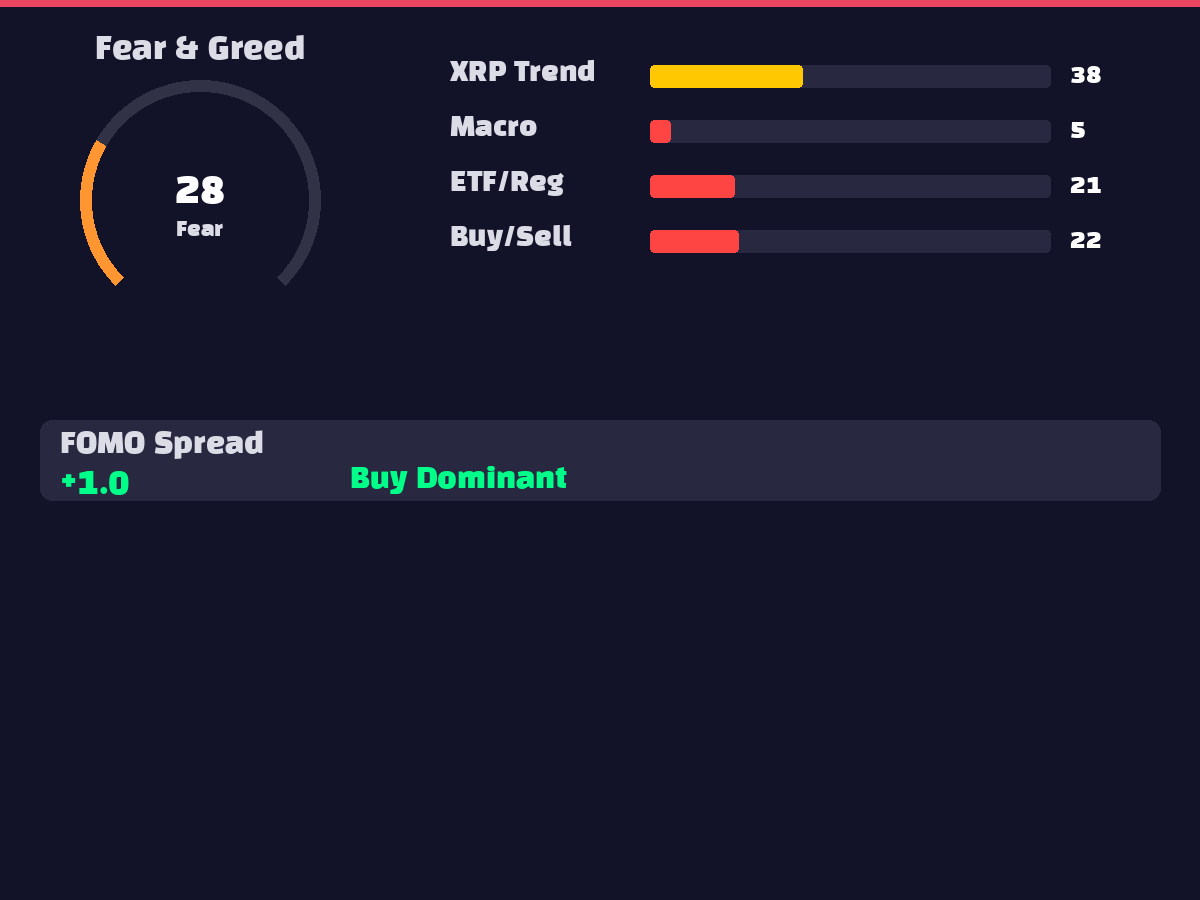
The Fear & Greed Index at 28 sits in extreme fear territory, suggesting potential market bottom formation. XRP search trends at 38 indicate relatively low public interest, confirming the absence of overheated conditions. Macroeconomic trends at 5 show minimal economic uncertainty concerns. ETF/regulatory trends at 21 remain below average, while FOMO spread at 1.0 indicates absence of excessive speculative behavior. XRP/BTC interest ratio of 0.9167 maintains substantial attention relative to Bitcoin.
6. 🐋 On-Chain Activity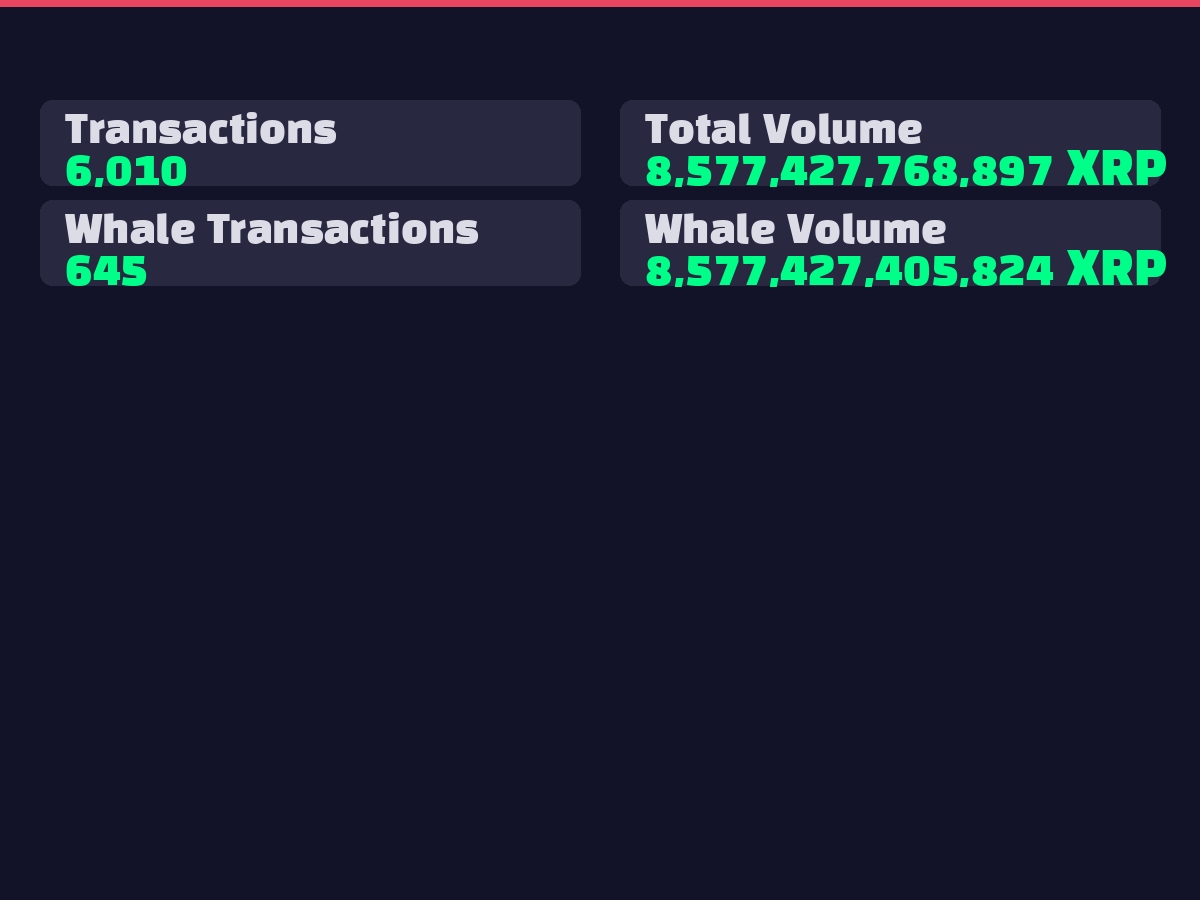
Whale transactions totaled 645 trades involving 8,577,427,405,824 XRP, demonstrating active large investor movement. With total transaction count at 6,010, the significant whale trading proportion indicates institutional and large investor market dominance. Total trading volume of 8,577,427,768,897 XRP ensures sufficient liquidity for large-scale transactions.
7. 📈 Elliott Wave / Wyckoff Analysis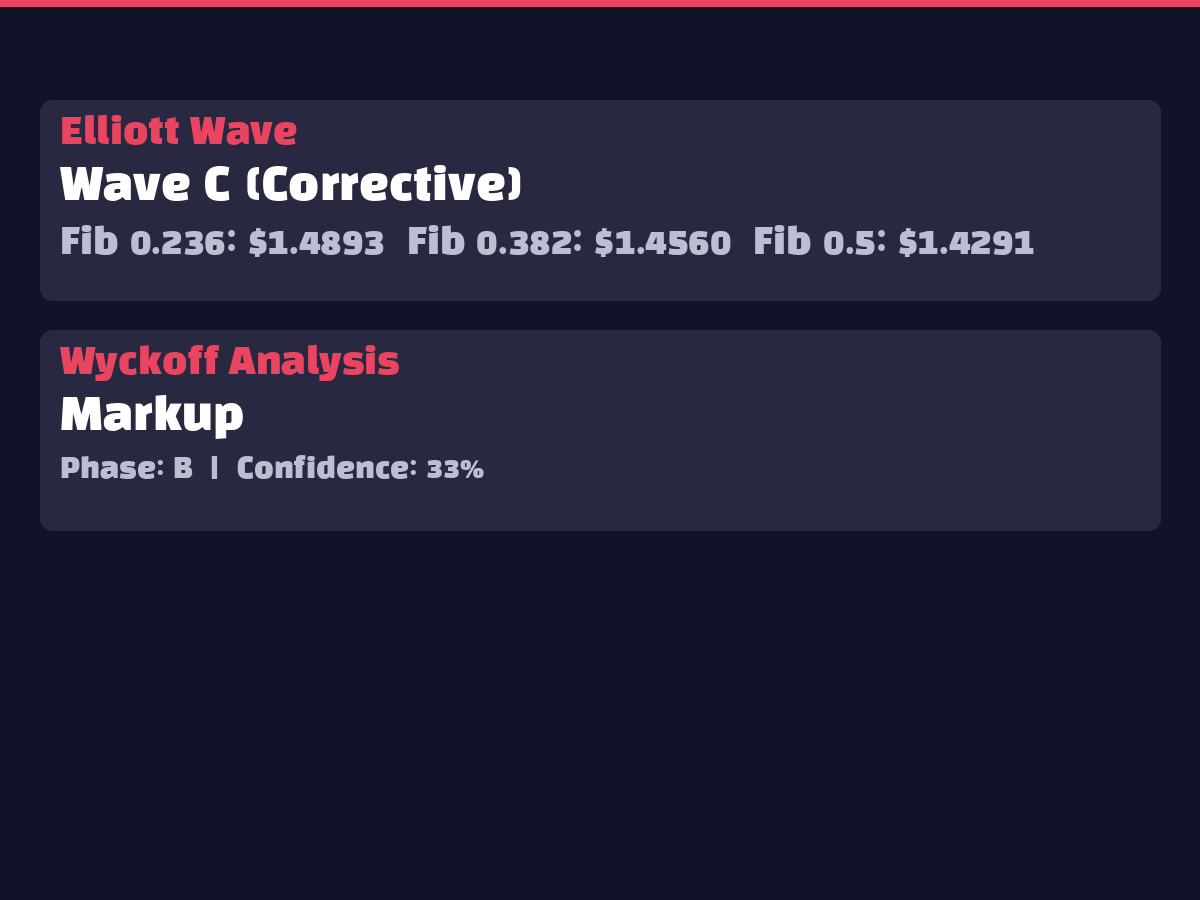
Current Elliott Wave analysis places XRP in Wave C (corrective), suggesting the downward correction phase may be approaching completion. Wyckoff analysis indicates the Markup phase, Stage B, with 33% confidence, suggesting early uptrend formation. Following Wave C correction completion, entry into a new upward cycle is anticipated, with the Markup phase characteristics pointing to gradual price appreciation.
8. 🤖 AI Prediction Analysis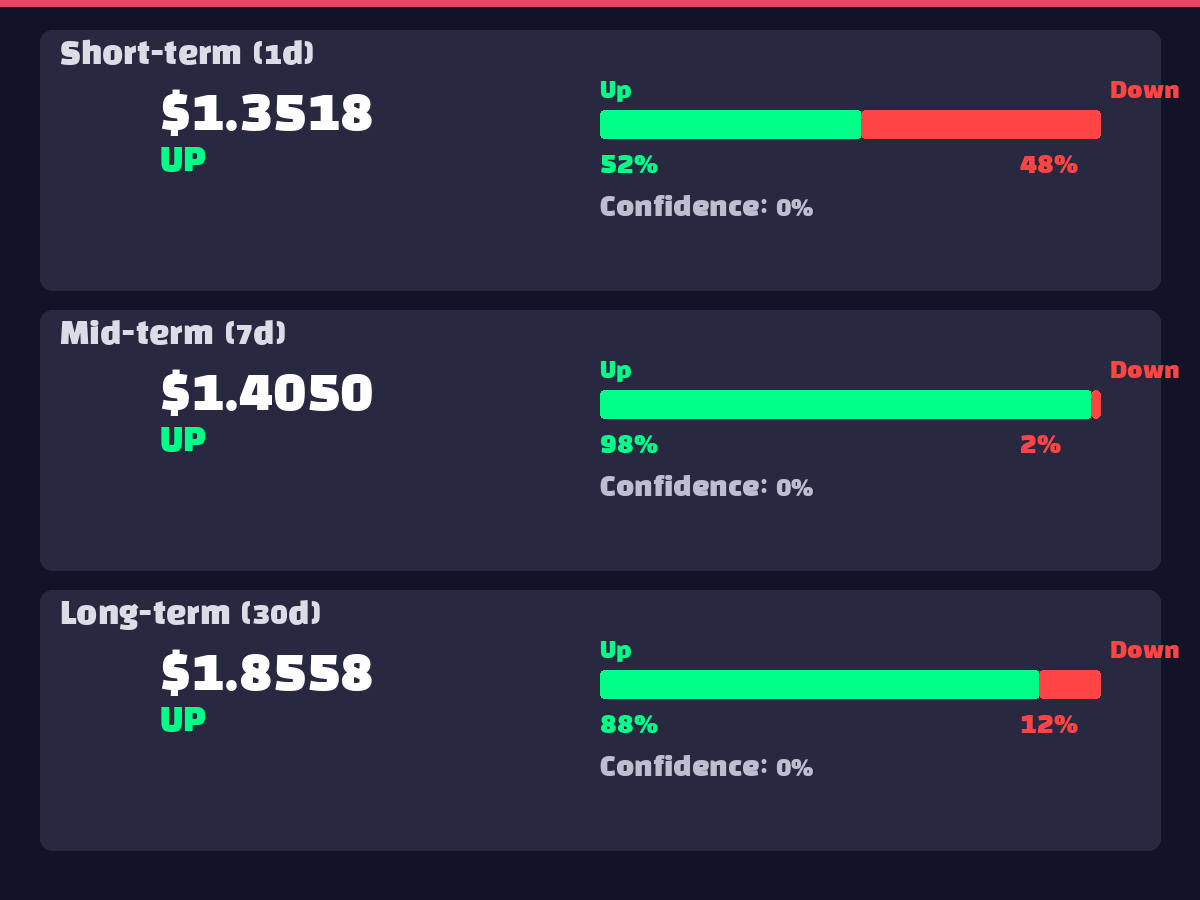
Short-term (1-day) predictions target $1.3518 with 52.3% upward probability, representing approximately 23% gain from current levels. Medium-term (7-day) forecasts show $1.4050 with 98.3% upward confidence, while long-term (30-day) predictions reach $1.8558 with 87.9% probability, indicating 69% potential upside. The pattern of increasing magnitude and confidence over longer timeframes demonstrates strong AI model conviction in XRP's medium to long-term appreciation.
9. ⚠️ Risk Factors
10. ✅ Comprehensive Recommendation
Recommendation: Gradual Accumulation (Wait and Enter)
Rationale: 1) AI medium-to-long-term predictions show 98.3% and 87.9% upward probabilities with 69% target appreciation 2) MACD histogram positive reversal and RSI 46.18 rebound potential 3) XRP ETF net inflows of $12.3M indicating sustained institutional capital influx
Strategic Entry Levels:
Stop Loss:
Price Targets: