XRP Market Analysis Report
Analysis Time: 2026-07-21 07:09 (UTC) / 2026-07-21 16:09 (KST)
1. 📌 Market Summary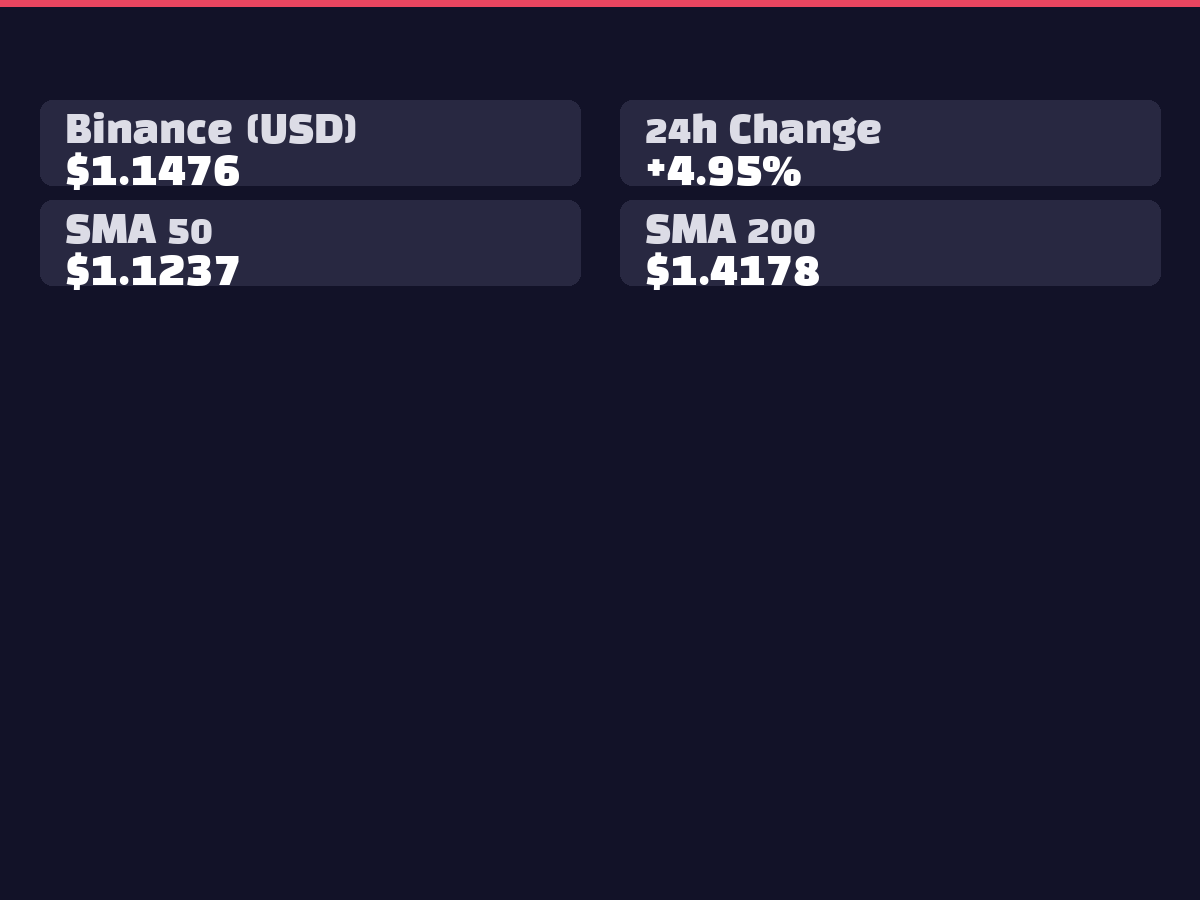
XRP is currently trading at $1.1347, showing strong bullish momentum with a 24-hour gain of 4.53%. On Bithumb, it's trading at ₩1,652 with a 3.57% increase. Despite active trading volume reaching 70.44 million XRP, the price remains 21.53% below the 200-day moving average ($1.4178), indicating it's in a medium to long-term recovery phase. XRP ETFs collectively recorded $15.8M in net inflows, demonstrating continued institutional interest in the asset.
2. 📊 Technical Analysis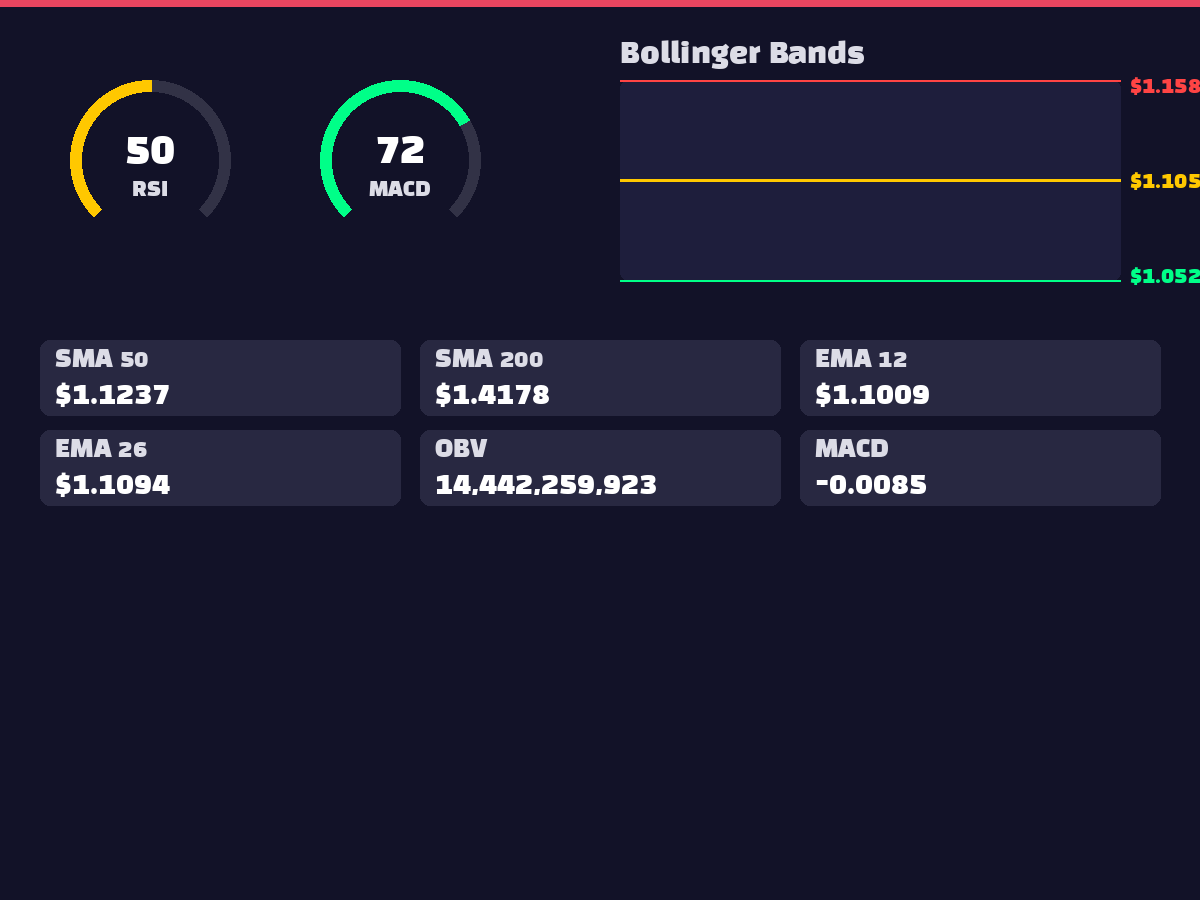
The RSI(14) at 50.47 indicates neutral territory without overbought or oversold conditions. MACD shows promising signals with the histogram at 0.0044, suggesting potential upward momentum shift from the current -0.0085 level. The current price ($1.1347) has broken above the Bollinger Bands middle line ($1.1053) and is moving toward the upper band ($1.1581). While the 5-day SMA ($1.0981) remains below the 20-day SMA ($1.1053), the narrowing gap suggests a potential golden cross formation. The OBV at 14.4 billion supports the upward movement with increasing volume participation.
3. 🌍 International Situation and Macroeconomics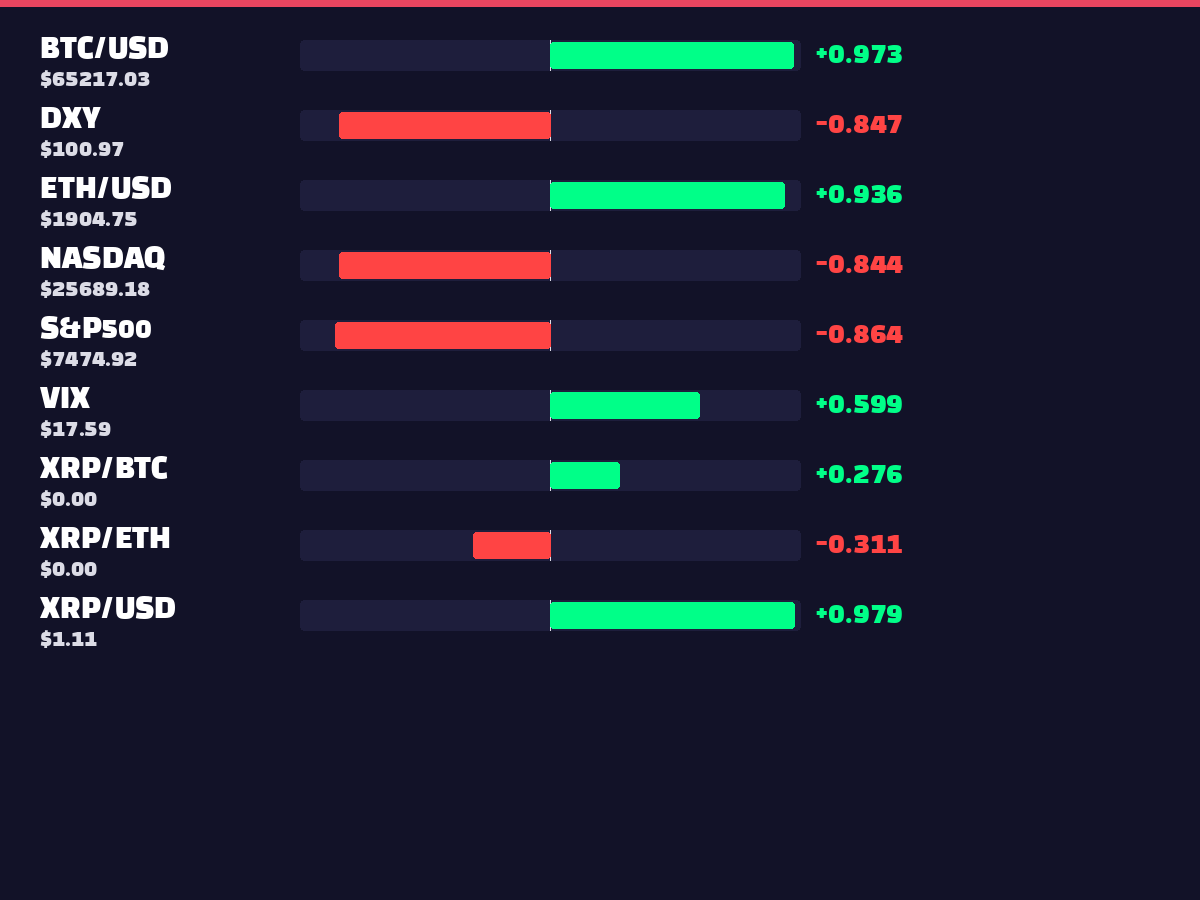
No significant international developments were identified in the current news collection. Correlation data reveals a strong negative correlation with DXY (-0.8477), suggesting XRP could benefit from dollar weakness. The inverse correlations with S&P500 (-0.8757) and NASDAQ (-0.8597) indicate potential for contrary movements to traditional financial markets. The positive correlation with VIX (0.6132) suggests XRP volatility may increase alongside market uncertainty indicators.
4. ⚖️ Regulatory and Legal Environment
No major regulatory changes were identified in the current news collection. The ETF/regulatory trend index stands at 18, relatively low, while six XRP ETFs continue operating normally with $15.8M in total net inflows, suggesting a stable regulatory environment.
5. 😱 Market Sentiment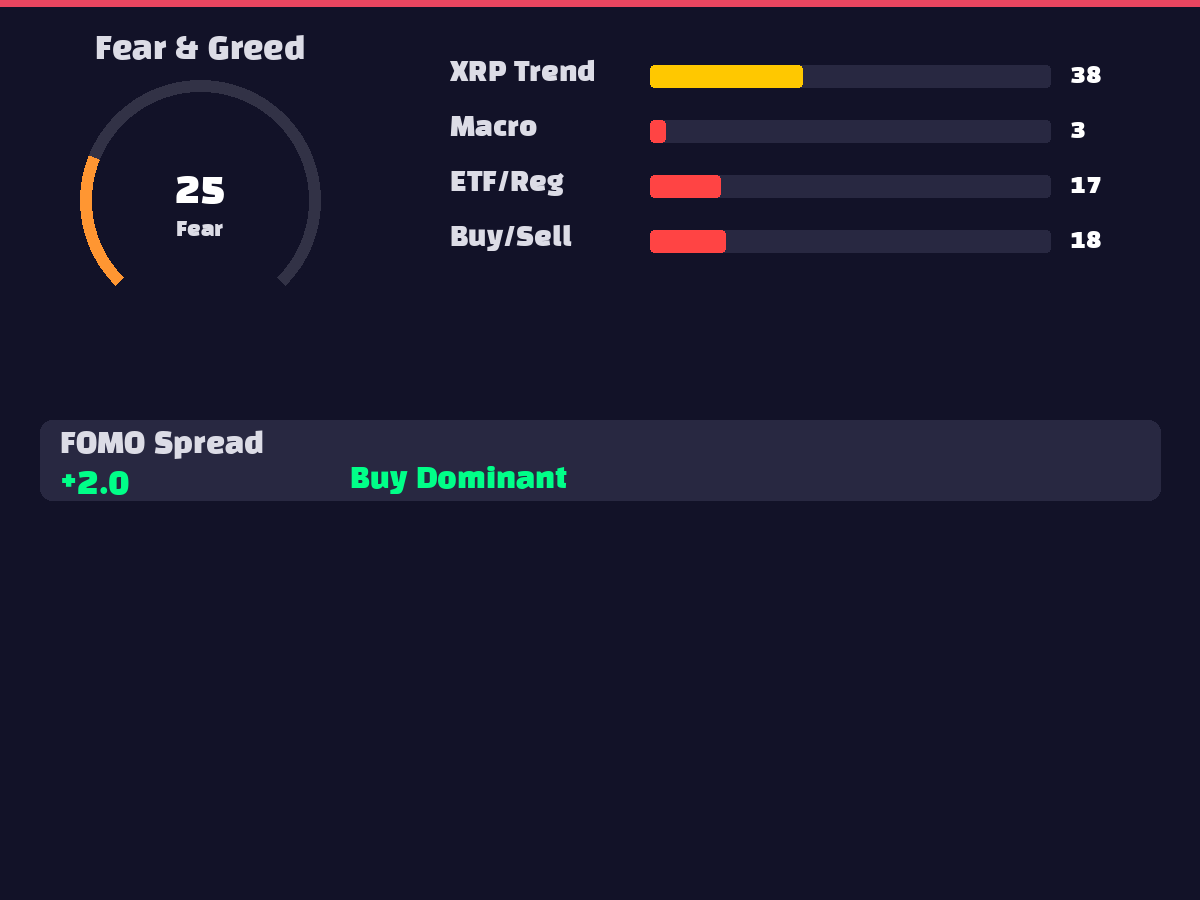
The Fear & Greed Index at 25 indicates "Extreme Fear" territory, showing prevailing pessimistic market sentiment. XRP search trends at 38 demonstrate moderate interest levels, while macroeconomic trends register only 4, indicating minimal economic concerns. ETF/regulatory interest remains relatively low at 18. The FOMO spread at 2.0 suggests absence of excessive buying pressure, and the XRP/BTC interest ratio of 1.0972 shows balanced attention compared to Bitcoin.
6. 🐋 On-Chain Activity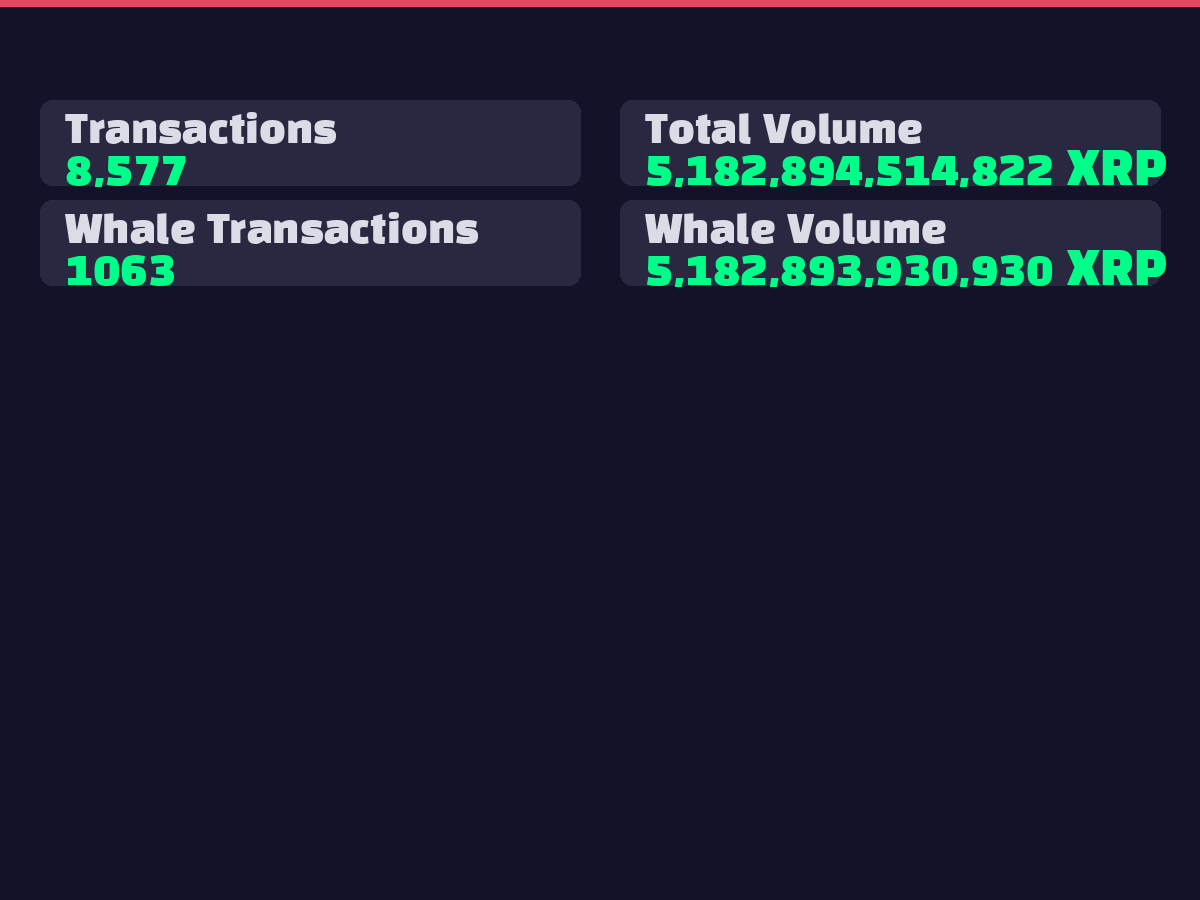
Whale transactions totaled 1,063 trades, representing the vast majority of the 5.18 trillion XRP total volume. Overall transaction count reached 8,577, indicating active retail participation. The dominant whale trading activity suggests major investors are actively adjusting positions, which could contribute to increased price volatility.
7. 📈 Elliott Wave / Wyckoff Analysis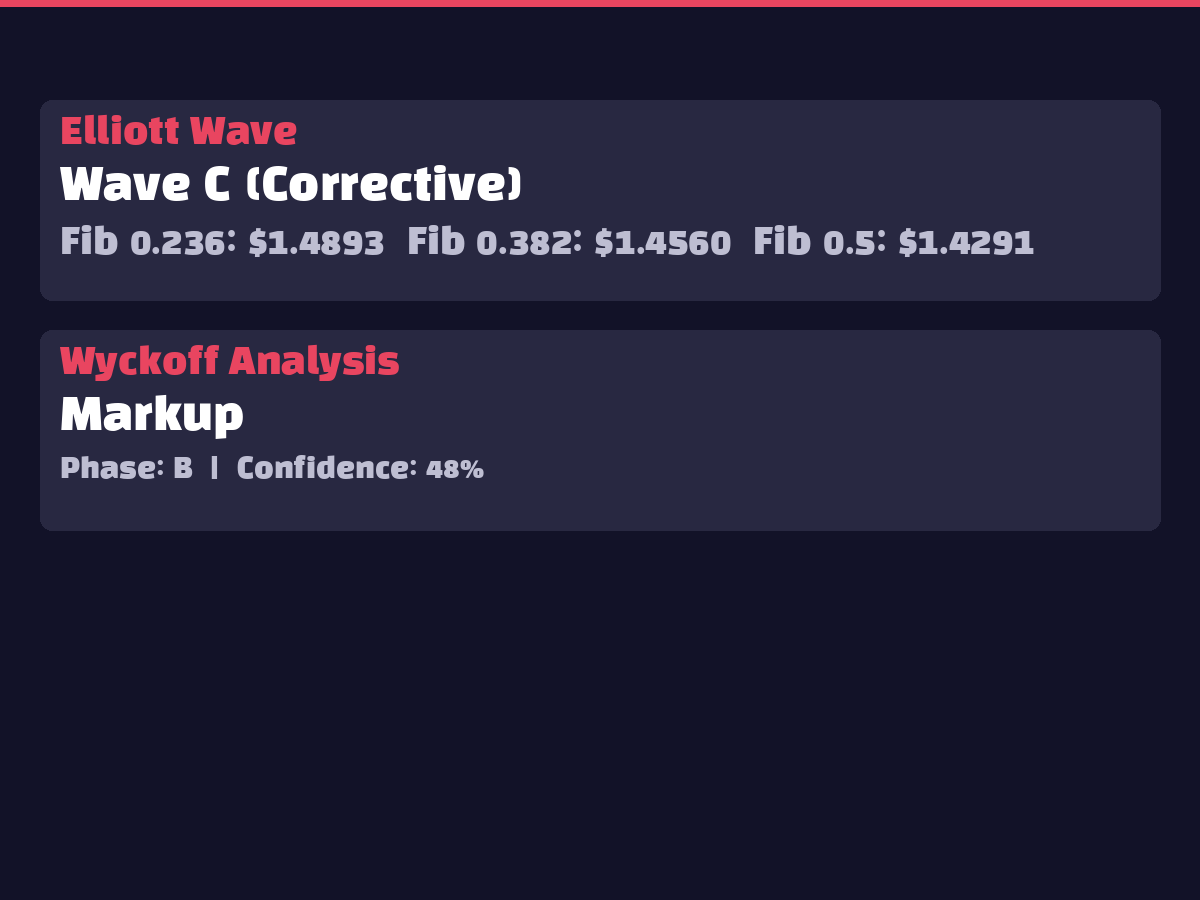
Currently positioned in Elliott Wave C (corrective), potentially indicating the final stage of a major downward correction. Wyckoff analysis places the market in the Markup phase, Stage B, suggesting preparation for trend resumption. With 48% confidence level, there's moderate probability of entering a new upward wave upon C-wave completion.
8. 🤖 AI Prediction Interpretation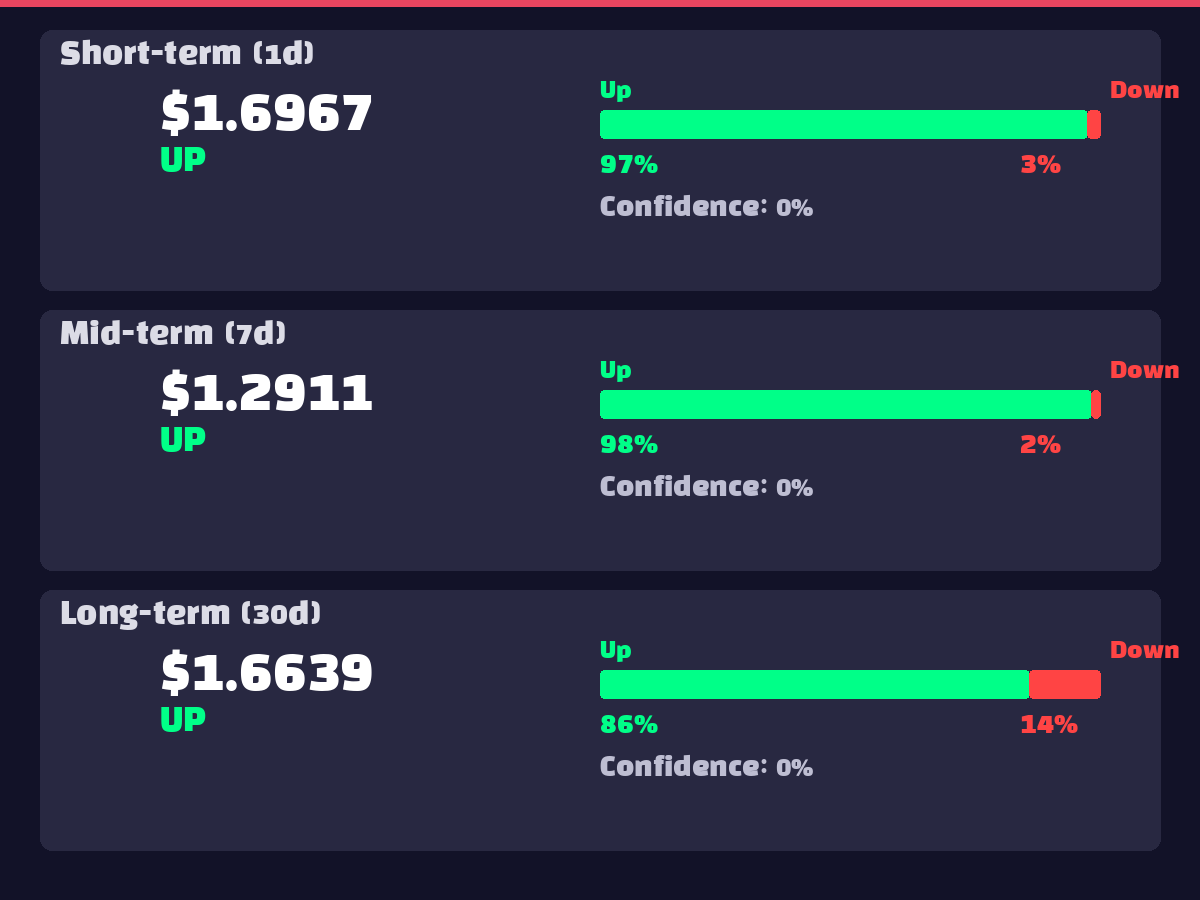
AI models present strongly bullish forecasts across all timeframes. Short-term (1-day) prediction of $1.6967 with 97.5% upward probability suggests a dramatic 49.5% surge from current levels. Medium-term (7-day) forecast of $1.2911 (98.4% upward probability) and long-term (30-day) projection of $1.6639 (85.9% upward probability) indicate sustained upward momentum. The exceptionally high confidence levels (97%+) for short and medium-term models suggest an imminent technical breakout.
9. ⚠️ Risk Factors
10. ✅ Overall Recommendation
Recommendation: BUY (Staged Dollar-Cost Averaging Recommended)
Rationale:
Specific Entry Strategy:
Implement staged buying from current levels to distribute risk, with consideration for additional purchases upon Bollinger Bands upper boundary ($1.1581) breakout.