1. 📌 Market Summary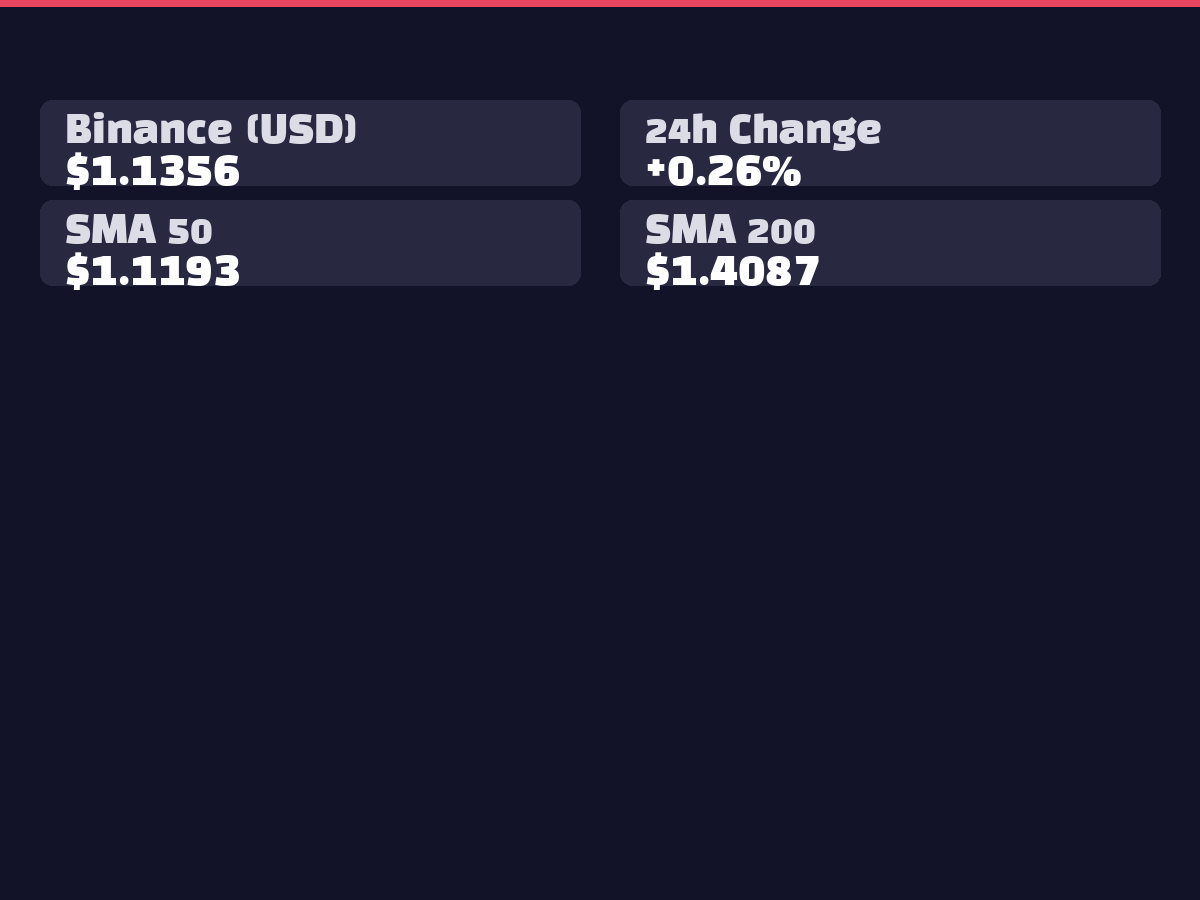
XRP is currently trading at $1.1349, showing a modest gain of +0.19% over the past 24 hours. The 24-hour range on Binance spans from a high of $1.1574 to a low of $1.1288, indicating relatively stable sideways movement. On Bithumb, XRP trades at ₩1,655 with a slight decline of -0.18%. With a healthy trading volume of 46 million XRP, the market shows gradual recovery signals from the correction phase.
2. 📊 Technical Analysis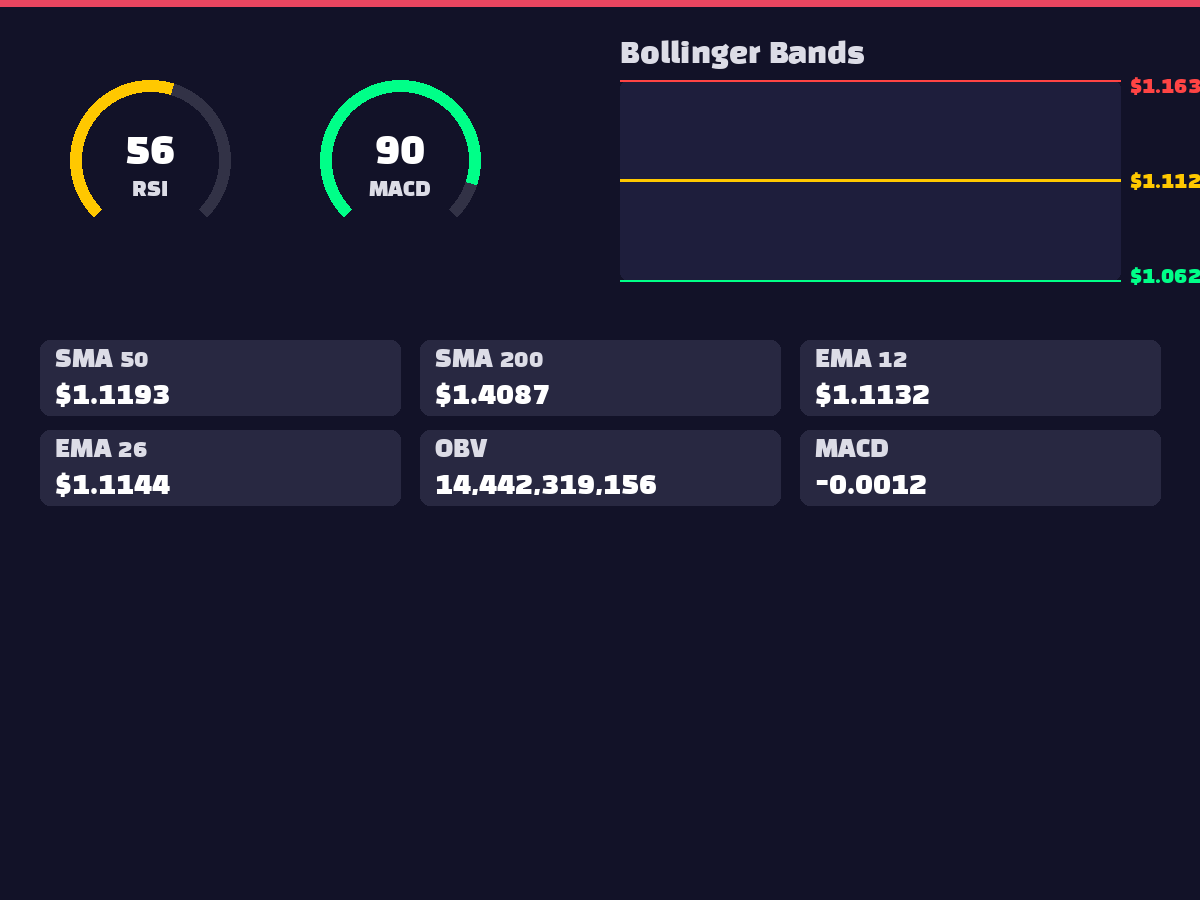
Current technical indicators present neutral signals. The RSI(14) stands at 56.51, positioned in neutral territory without indicating overbought or oversold conditions. The MACD remains negative at -0.0012, but the histogram has turned positive at 0.0080, suggesting improving momentum. Within the Bollinger Bands, the current price trades above the middle line (1.1127), indicating upward bias. Short-term moving averages (SMA 5-day: 1.1201, 20-day: 1.1127) provide support near current levels, though the significant 18.87% gap below the 200-day SMA (1.4087) confirms the persistent medium-term downtrend.
3. 🌍 International Geopolitics and Macroeconomics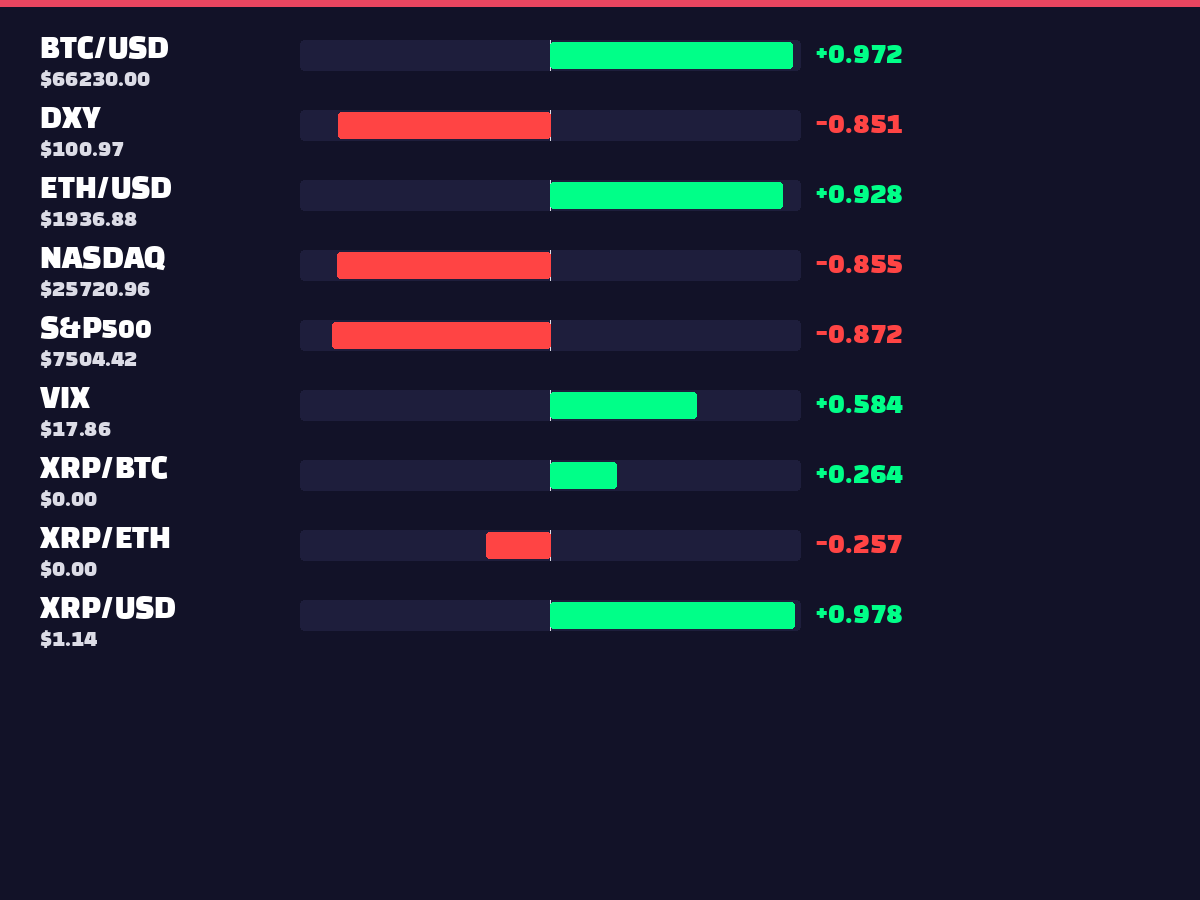
No major international geopolitical developments have been identified in the collected news data. Correlation analysis reveals a strong negative correlation of -0.8513 with DXY, suggesting XRP strength during dollar weakness. Strong negative correlations with S&P500 (-0.8723) and NASDAQ (-0.8547) indicate potential cryptocurrency inflows during traditional market corrections. The positive correlation of 0.6033 with VIX suggests increased volatility during market uncertainty.
4. ⚖️ Regulatory and Legal Environment
No significant regulatory changes have been identified in the current news collection. However, XRP ETF data shows mixed inflow patterns across six ETFs, with the XRP ($12.71) ETF recording the largest net inflow of $7.0M, demonstrating sustained institutional interest.
5. 😱 Market Sentiment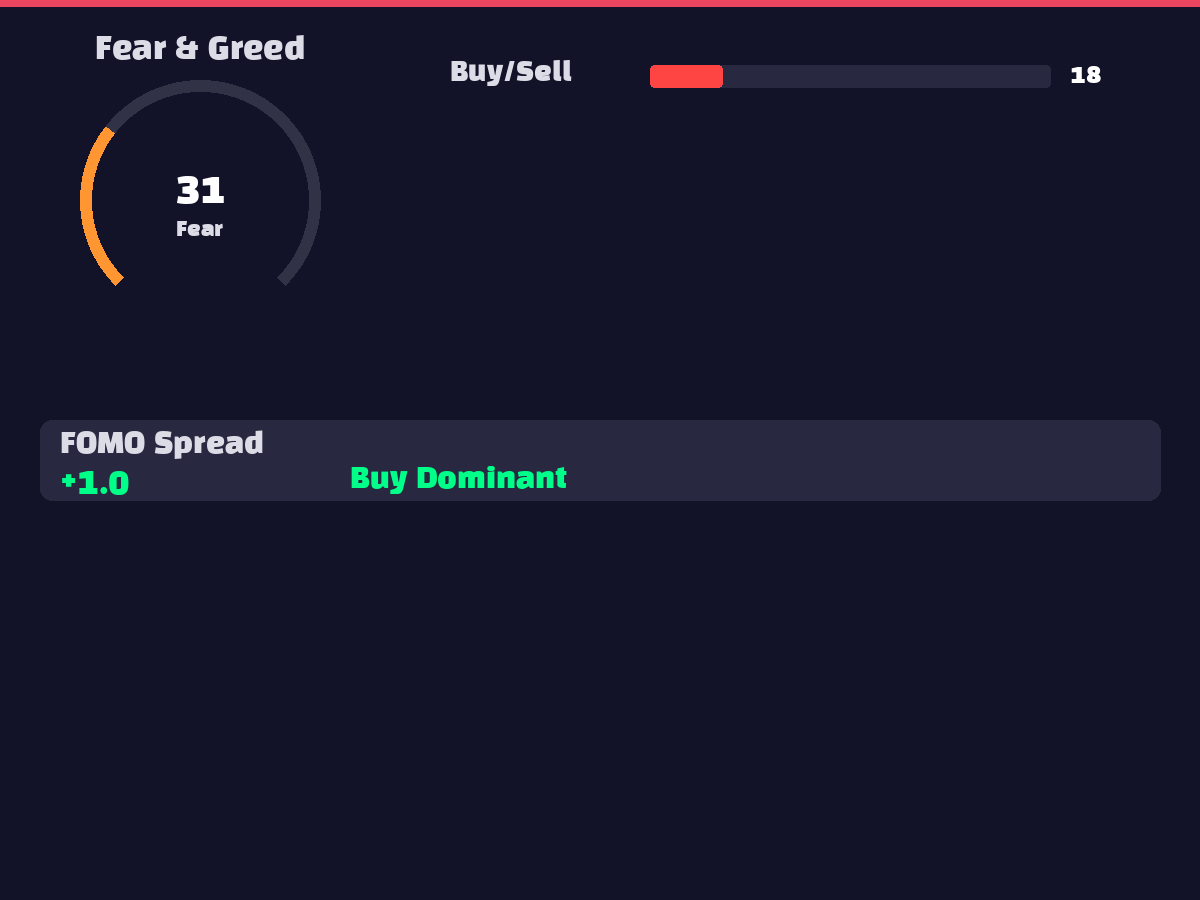
The Fear & Greed Index sits at 31, indicating "Fear" territory and reflecting conservative investor sentiment. The FOMO spread remains neutral at 1.0, showing absence of aggressive buying pressure. These indicators suggest the market maintains balanced conditions without extreme optimism or pessimism, requiring additional catalysts for clear directional momentum.
6. 🐋 On-Chain Activity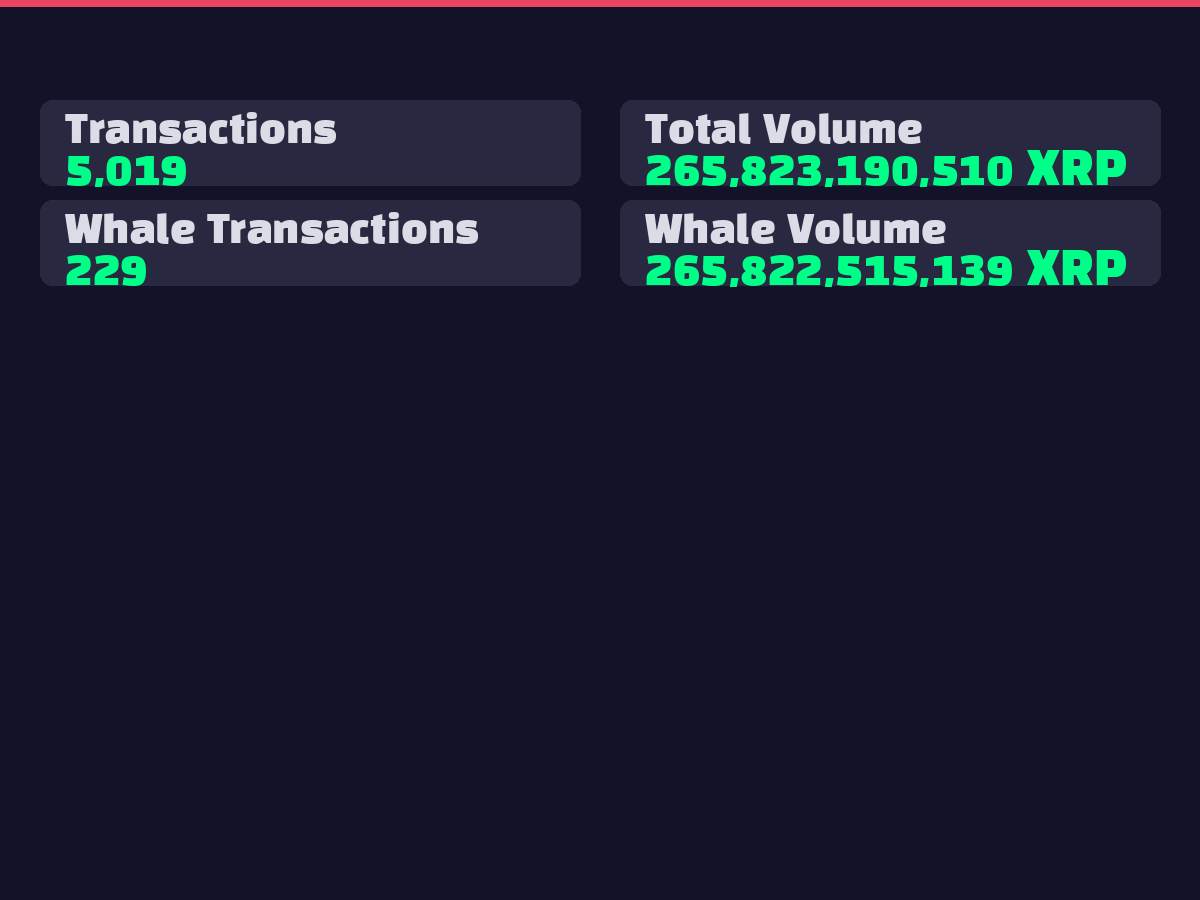
Whale transactions totaled 229 trades involving 265,822,515,139 XRP, representing nearly 100% of total trading volume (265,823,190,510 XRP). This exceptionally high whale participation ratio among 5,019 total transactions indicates active positioning by large investors. Such concentrated large-scale movements suggest institutional or high-net-worth investors are actively adjusting positions at current price levels, potentially increasing future volatility.
7. 📈 Elliott Wave / Wyckoff Analysis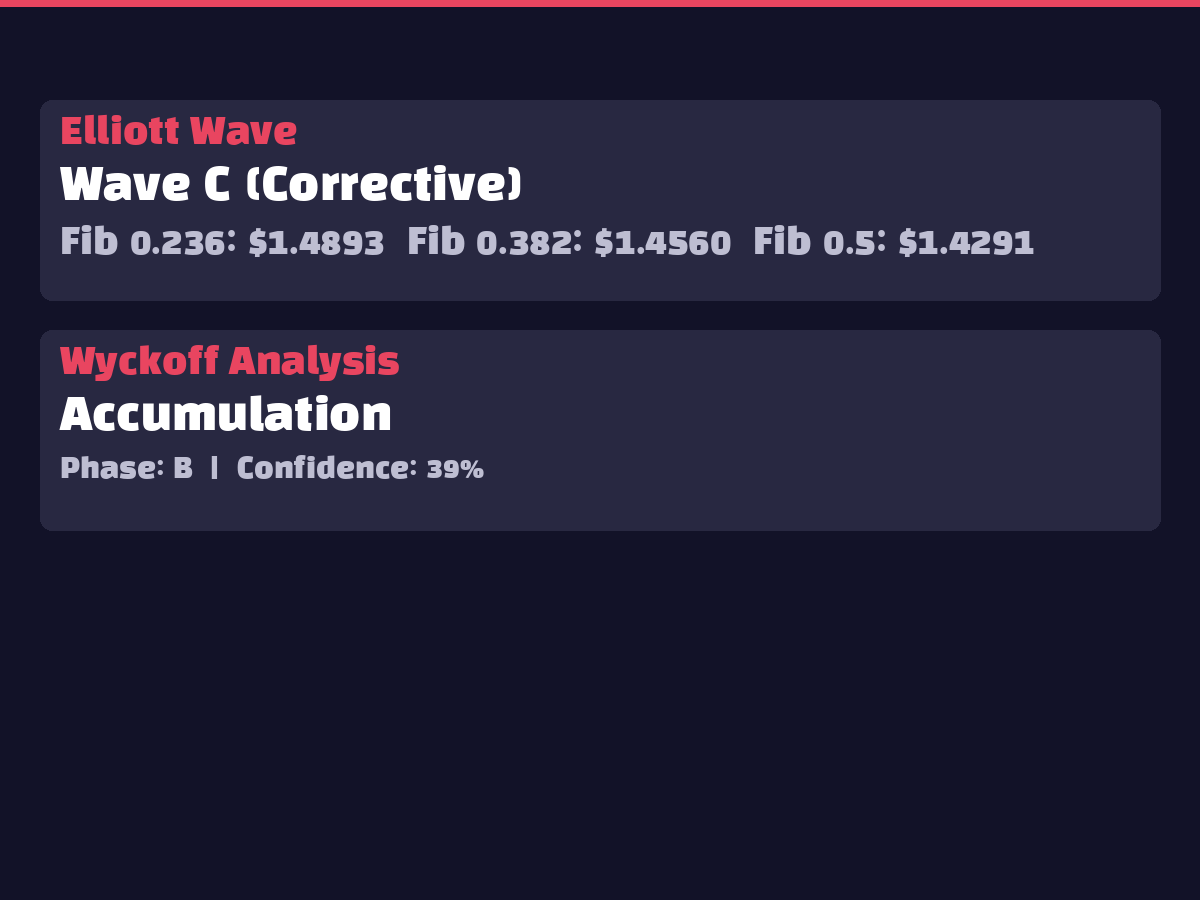
Elliott Wave analysis places XRP currently in Wave C (corrective), indicating ongoing downward correction. Wyckoff analysis identifies the Accumulation phase, specifically Stage B, with 39% confidence. This suggests large capital may be accumulating at lower price levels, though the relatively low confidence requires additional confirmation. Attention should focus on potential new upward wave initiation following C-wave correction completion.
8. 🤖 AI Prediction Analysis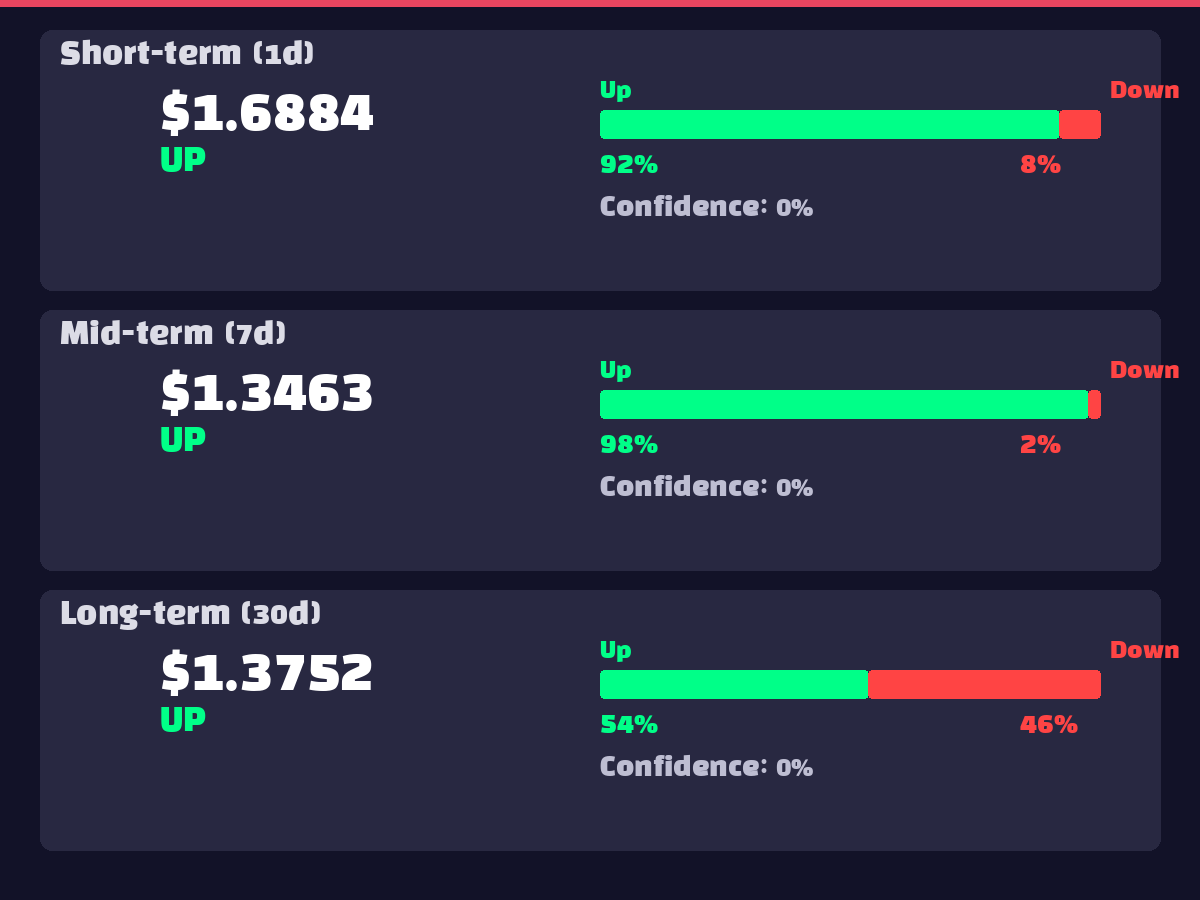
AI ensemble model predictions reveal interesting patterns. Short-term (1-day) prediction targets $1.6884, suggesting a 48.7% surge with 91.9% upward probability. Medium-term (7-day) forecasts $1.3463 (97.7% upward probability), while long-term (30-day) predicts $1.3752 (53.7% upward probability). Notably, short-term targets exceed medium-term predictions, suggesting potential rapid gains followed by correction. Decreasing probability over longer timeframes reflects increasing uncertainty.
9. ⚠️ Risk Factors
10. ✅ Comprehensive Opinion
Recommendation: Gradual Accumulation (Conditional)
XRP appears positioned in early technical recovery stages, with AI models signaling strong short-term upside and active whale movements suggesting limited buying opportunities.
Key Rationale:
Specific Strategy: