XRP Market Analysis Report
Analysis Time: July 24, 2026, 16:09 (KST) / July 24, 2026, 07:09 (UTC)
1. 📌 Market Summary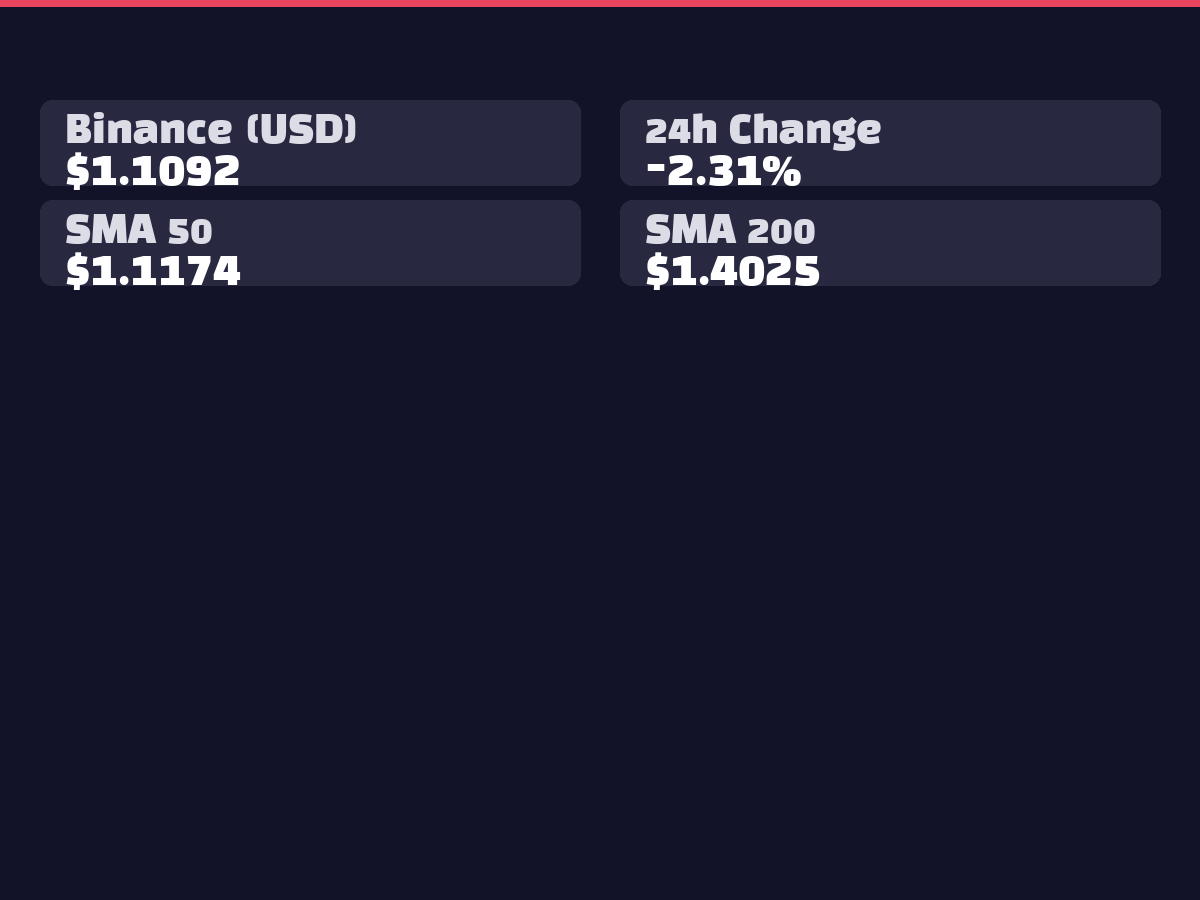
XRP is currently trading at $1.1169, down -1.53% over the past 24 hours. The token moved within a range of $1.1373 (high) to $1.1006 (low) on Binance, while Bithumb KRW price stands at ₩1,627, down -1.63%. Trading volume remains moderate at 52.33 million XRP, however, XRP ETFs are experiencing overall net outflows totaling -$13.2M. With RSI at 48.28 in neutral territory, XRP appears to be in a short-term consolidation phase requiring directional confirmation.
2. 📊 Technical Analysis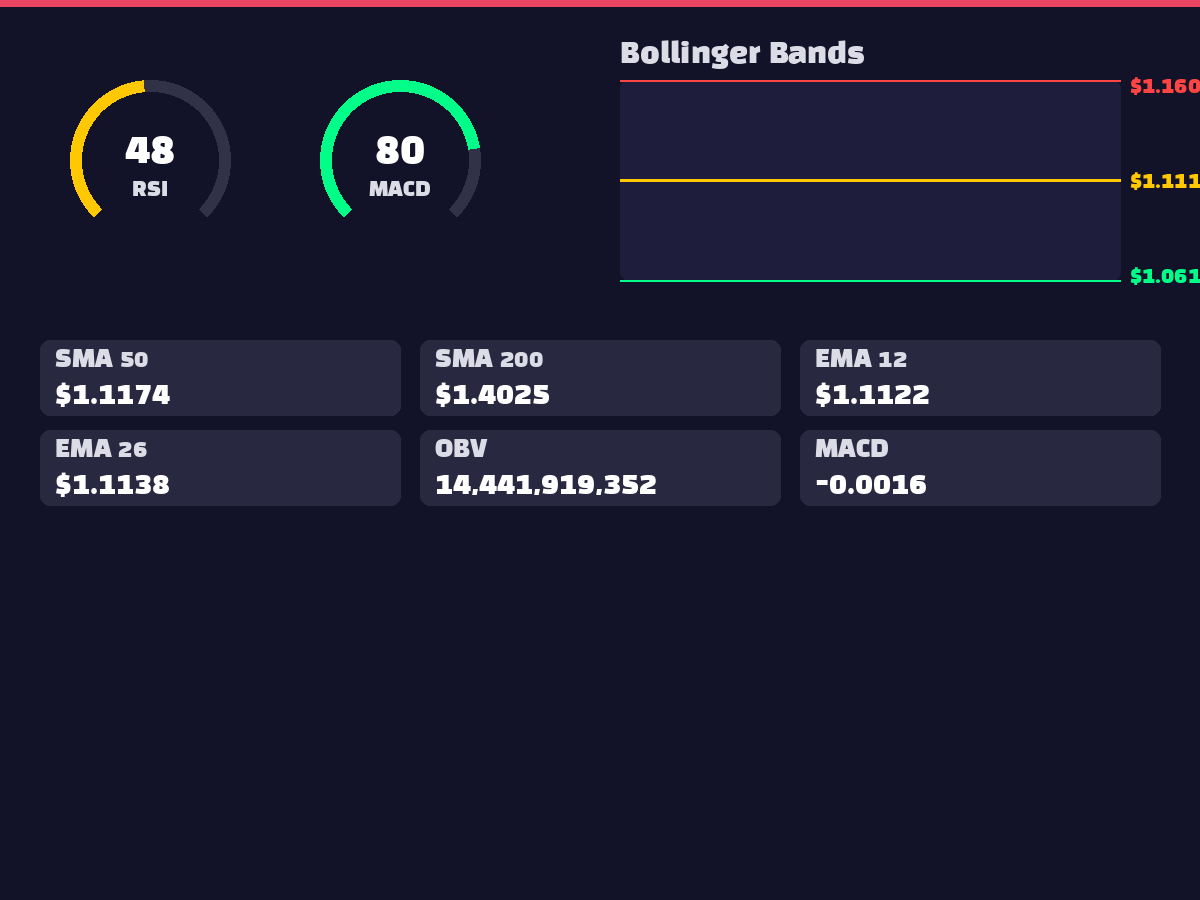
RSI at 48.28 indicates neutral momentum with no overbought/oversold signals, while MACD (-0.0016) above signal line (-0.0077) with positive histogram (0.0061) suggests potential bullish momentum recovery. Current price ($1.1169) trades near Bollinger Bands middle line ($1.1113) showing support, though below 5-day SMA (1.1227) confirms short-term weakness. The 50-day deviation of -0.95% appears healthy, but the -21.09% deviation from 200-day SMA (1.4025) indicates persistent medium-term downtrend. OBV at 14.4 billion level requires volume confirmation for sustained moves.
3. 🌍 International Affairs & Macroeconomics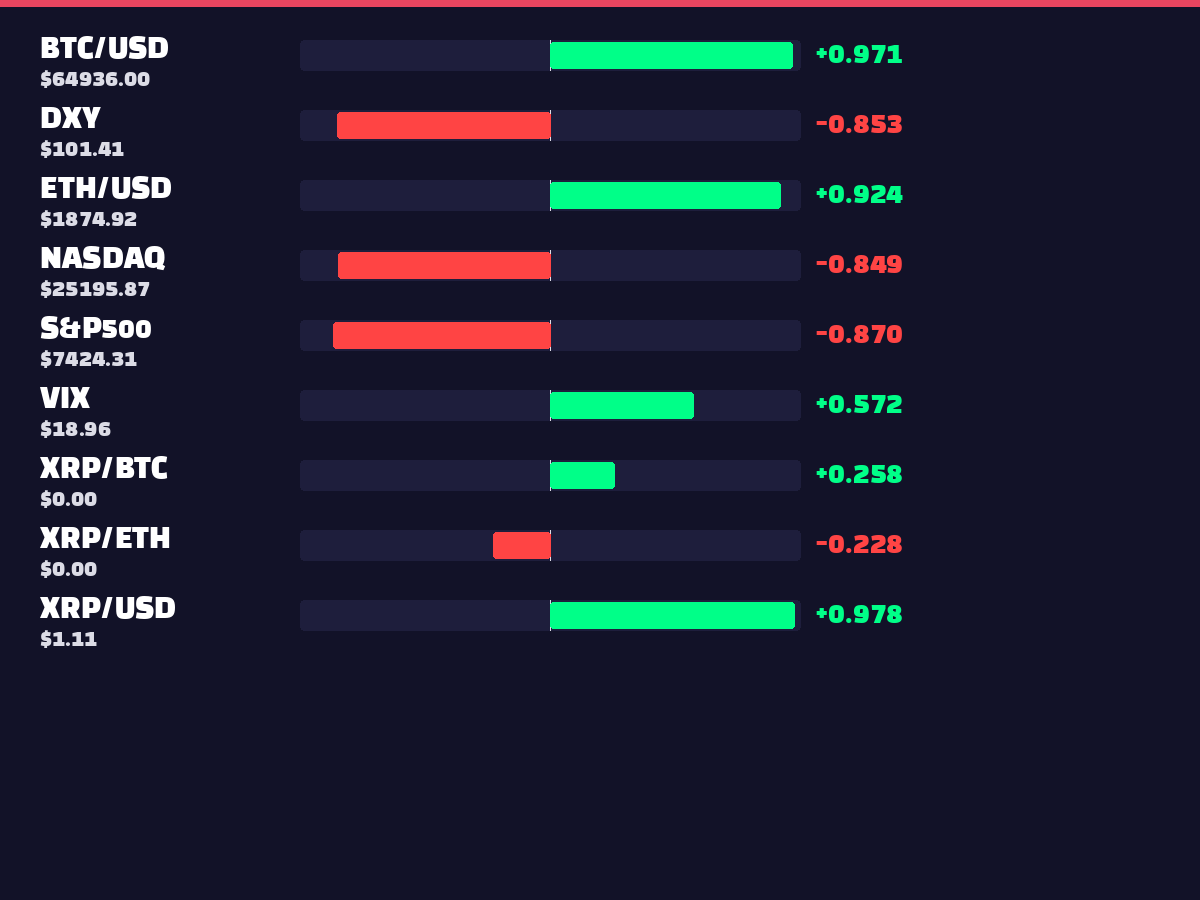
No major international developments were identified in current news feeds. However, correlation data reveals strong negative correlation with DXY (-0.8527), indicating XRP weakness during dollar strength periods. Negative correlations with S&P500 (-0.8702) and NASDAQ (-0.8492) suggest crypto outflows during equity market rallies. The positive correlation with VIX (17.86) at 0.5938 indicates XRP's tendency to decline during market uncertainty periods.
4. ⚖️ Regulatory & Legal Environment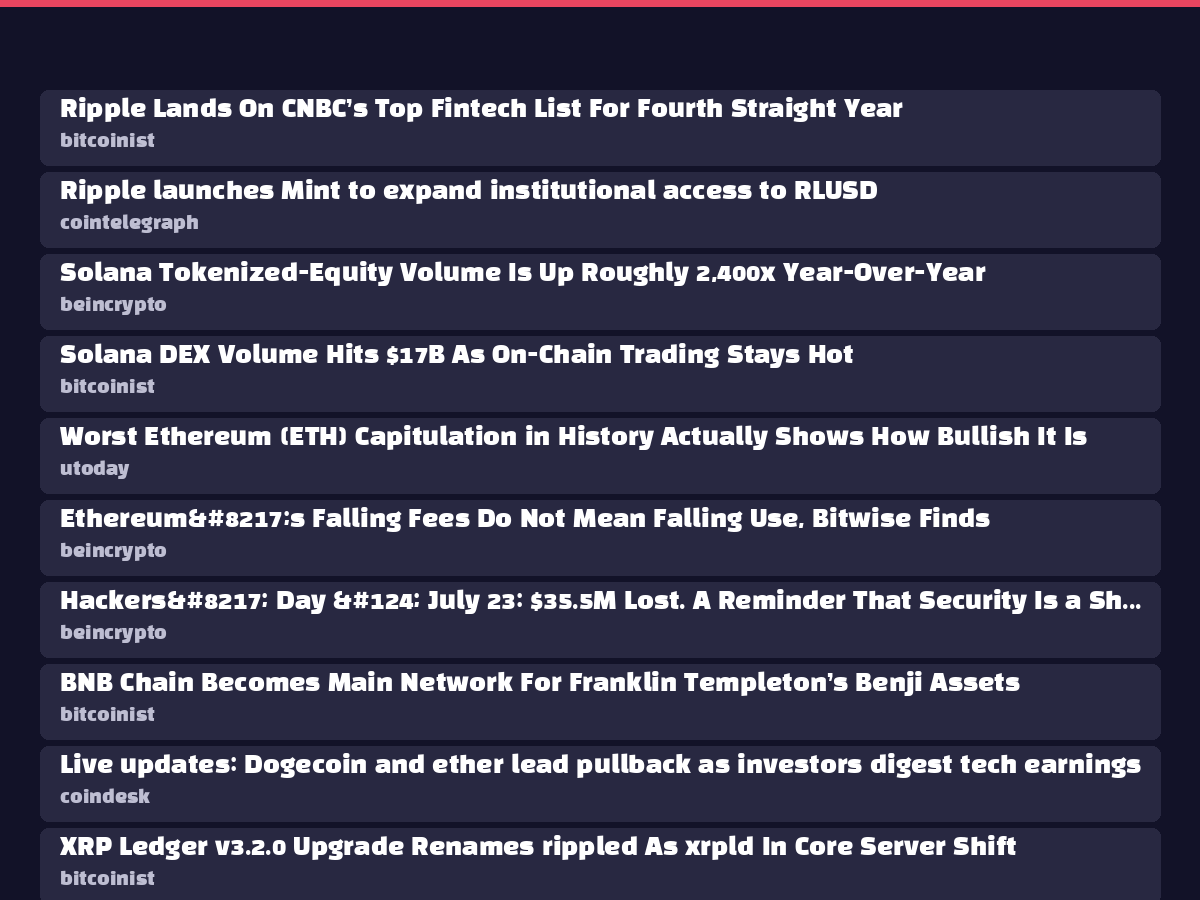
No significant regulatory developments were identified in current news collection. Six XRP ETF products continue normal operations, though experiencing net outflows ranging from $1.7M to $4.8M, which appears to reflect institutional position adjustments rather than fundamental concerns.
5. 😱 Market Sentiment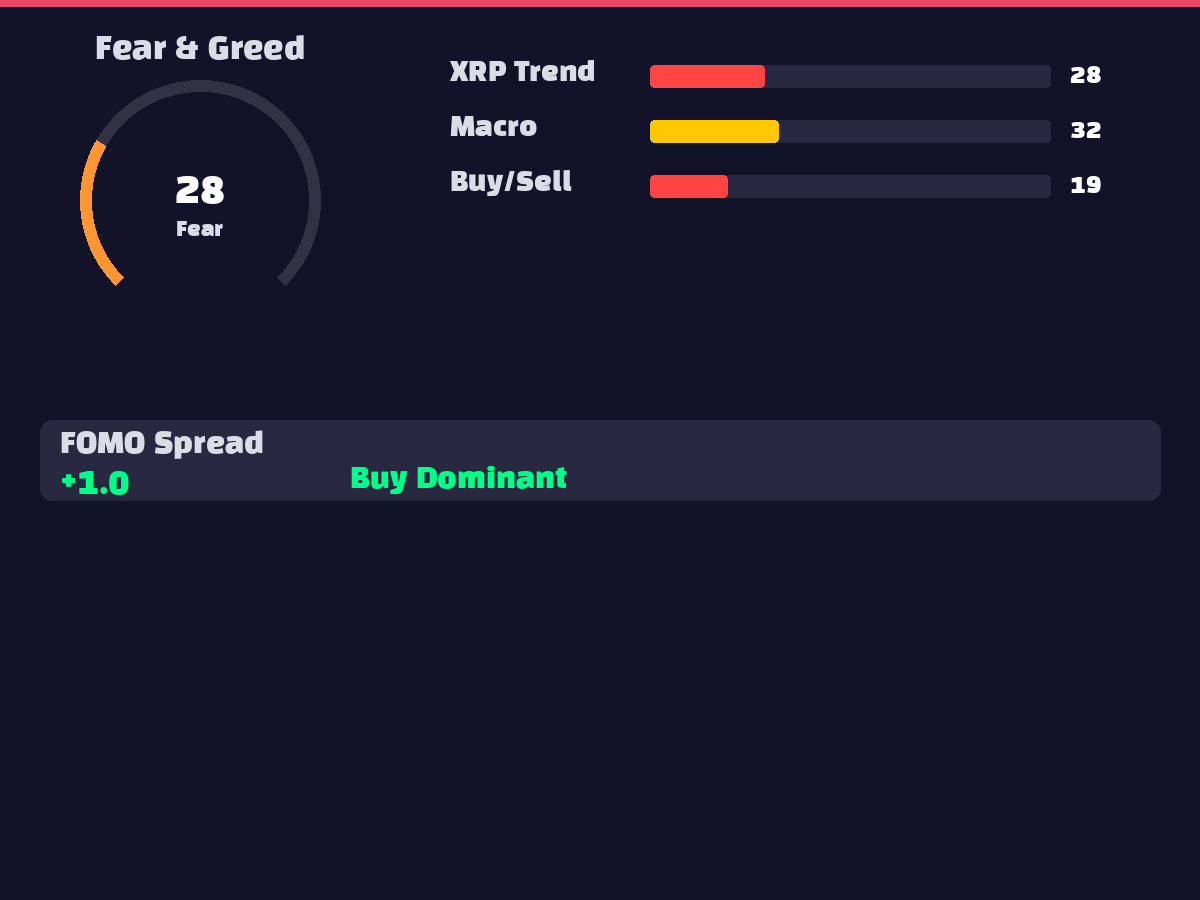
Fear & Greed Index at 28 approaches "extreme fear" territory, while XRP search trends at 29 indicate significantly low public interest. Macroeconomic trends at 32 reflect ongoing economic uncertainty concerns. FOMO spread remains neutral at 1.0, but XRP/BTC interest ratio of 0.7237 shows relatively low attention compared to Bitcoin. Overall market participants demonstrate strong risk-aversion behavior.
6. 🐋 On-Chain Activity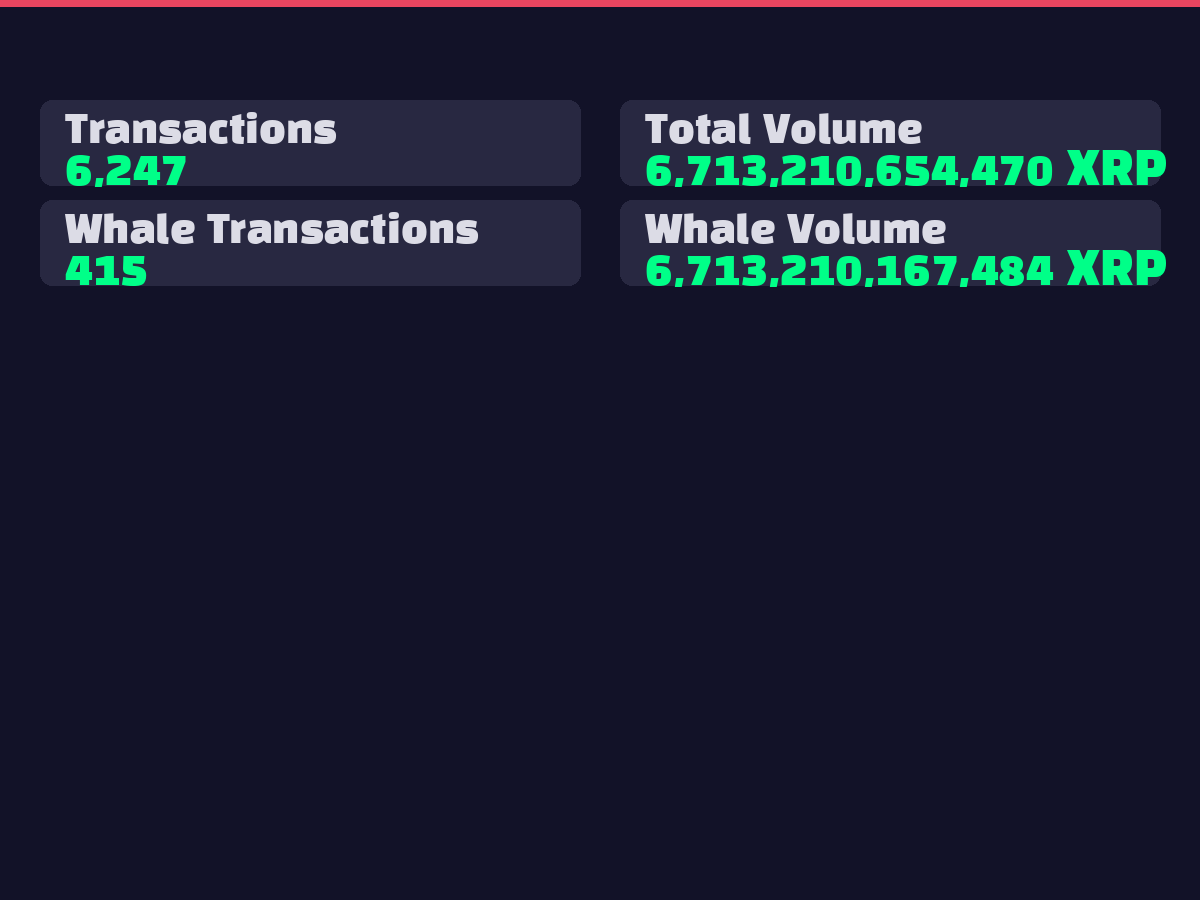
Whale transactions totaled 415 trades involving 6.71 trillion XRP, matching total transaction volume levels. The high whale-to-retail ratio (415 whale trades vs 6,247 regular transactions) indicates active large investor position adjustments. Significant whale activity appears to be driving current price volatility, suggesting strategic institutional trading rather than panic selling.
7. 📈 Elliott Wave / Wyckoff Analysis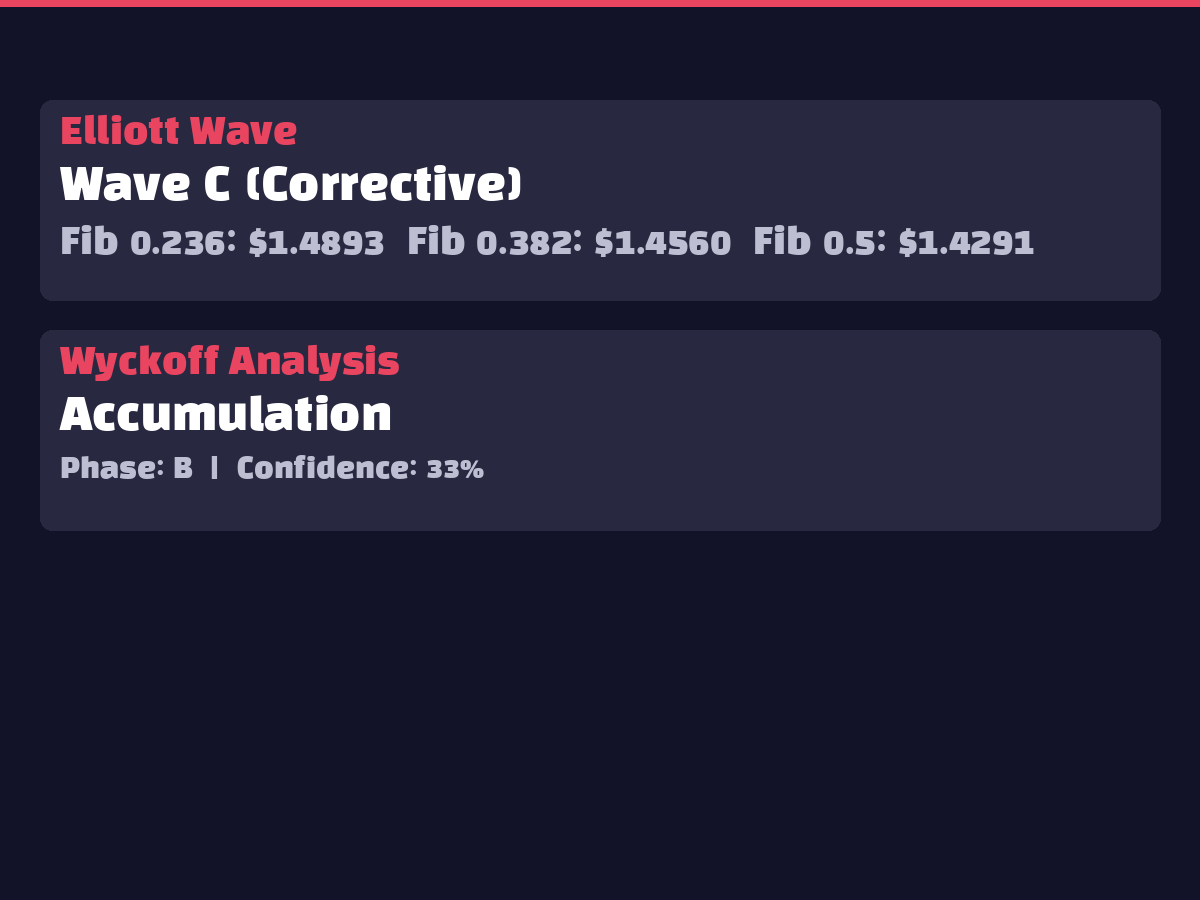
Elliott Wave analysis places XRP in corrective C-wave territory, while Wyckoff analysis identifies Accumulation phase B stage with 33% confidence level. Upon C-wave completion, transition to new bullish cycle expected. The accumulation phase typically involves gradual smart money buying, though additional confirmation signals needed given low confidence rating.
8. 🤖 AI Prediction Analysis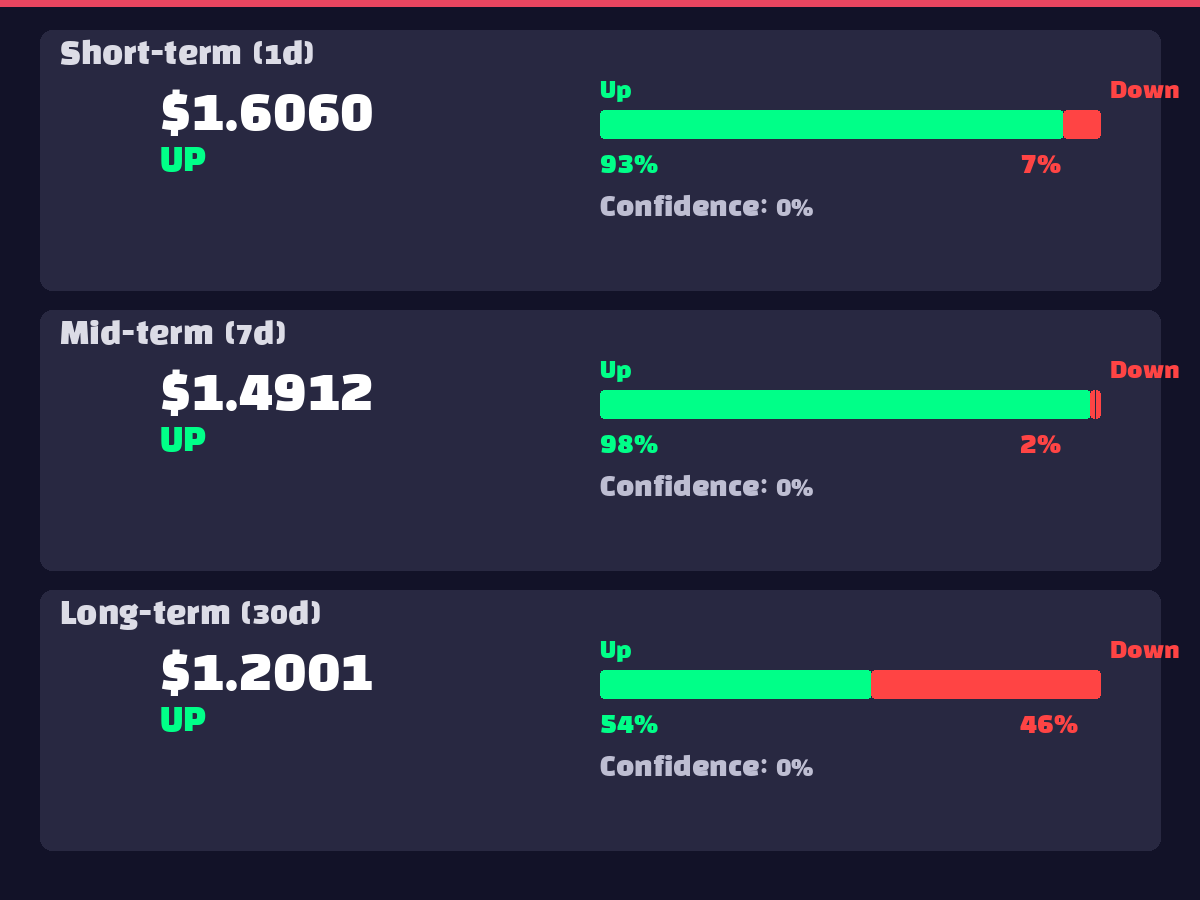
AI ensemble models predict dramatic short-term (1-day) rally to $1.6060 (+43.9%) with 92.8% probability. Medium-term (7-day) targets $1.4912 (+33.5%) with higher 98.1% confidence. Long-term (30-day) moderates to $1.2001 (+7.4%) with 54.3% probability. The declining confidence over time suggests high technical bounce potential from current oversold levels, though sustainability remains questionable.
9. ⚠️ Risk Factors
10. ✅ Overall Recommendation
Recommendation: WAIT (Prepare for Short-term Buy Opportunity)
Current analysis suggests cautious waiting for optimal entry. Three key rationales support this stance: 1) AI models predict imminent sharp rally (92.8% probability) suggesting oversold bounce opportunity, 2) Fear & Greed at 28 with institutional outflows indicate further downside risk exists, and 3) While MACD histogram turns positive and Wyckoff shows accumulation signals, additional technical confirmation needed for high-conviction entry.
Specific Trading Strategy: