XRP Market Analysis Report
Analysis Time: July 26, 2026 16:10 (KST) / 2026-07-26 07:10 (UTC)
1. 📌 Market Summary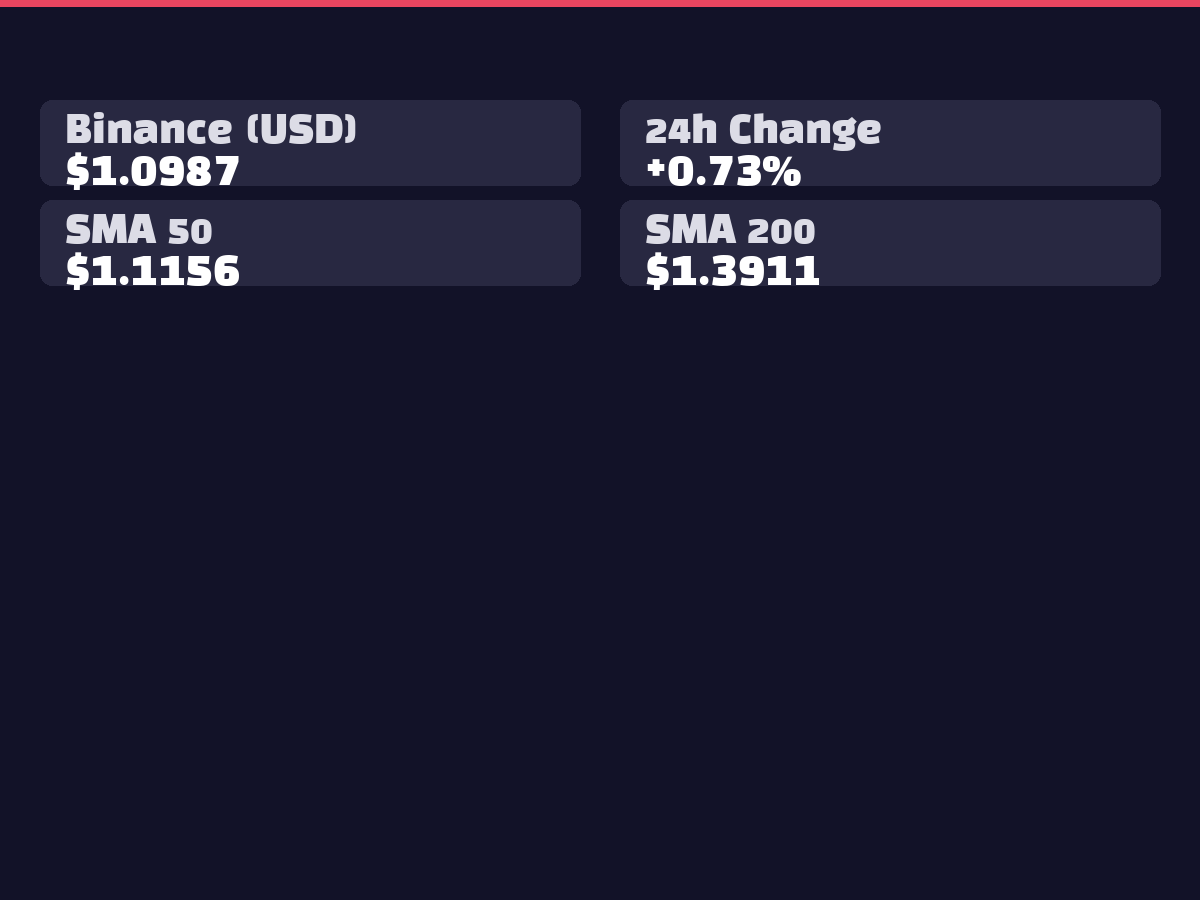
XRP is currently trading at $1.1007, showing a modest gain of +1.12% over the past 24 hours. On Bithumb, it's trading at ₩1,609 with a 24-hour change of 1.00%. The asset maintains a high correlation with Bitcoin (0.9707), moving in sync with the broader cryptocurrency market trends. Currently consolidating near the Bollinger Bands middle line ($1.1052), XRP appears to be searching for directional clarity in a sideways trading pattern.
2. 📊 Technical Analysis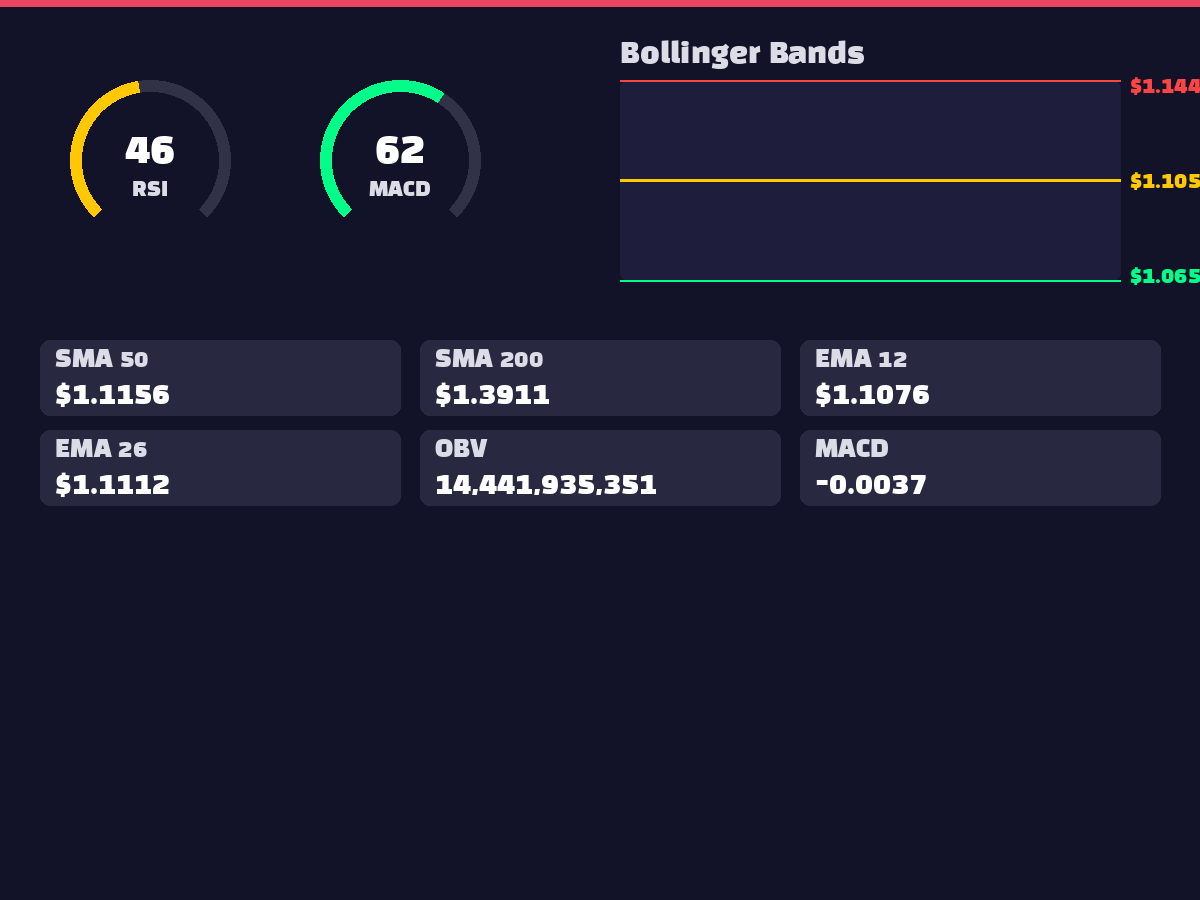
The RSI(14) stands at 47.00, positioned in neutral territory with no overbought or oversold signals present. The MACD remains negative at -0.0037, but the histogram has turned positive to 0.0025, indicating early signs of upward momentum. Within the Bollinger Bands, XRP is trading near the middle line ($1.1052), suggesting compressed volatility. Moving average analysis reveals the current price sits -21.00% below the 200-day MA ($1.3911), indicating a persistent long-term downtrend. The OBV at 14,441,935,351 suggests volume-based buying pressure is building.
3. 🌍 International Affairs and Macroeconomics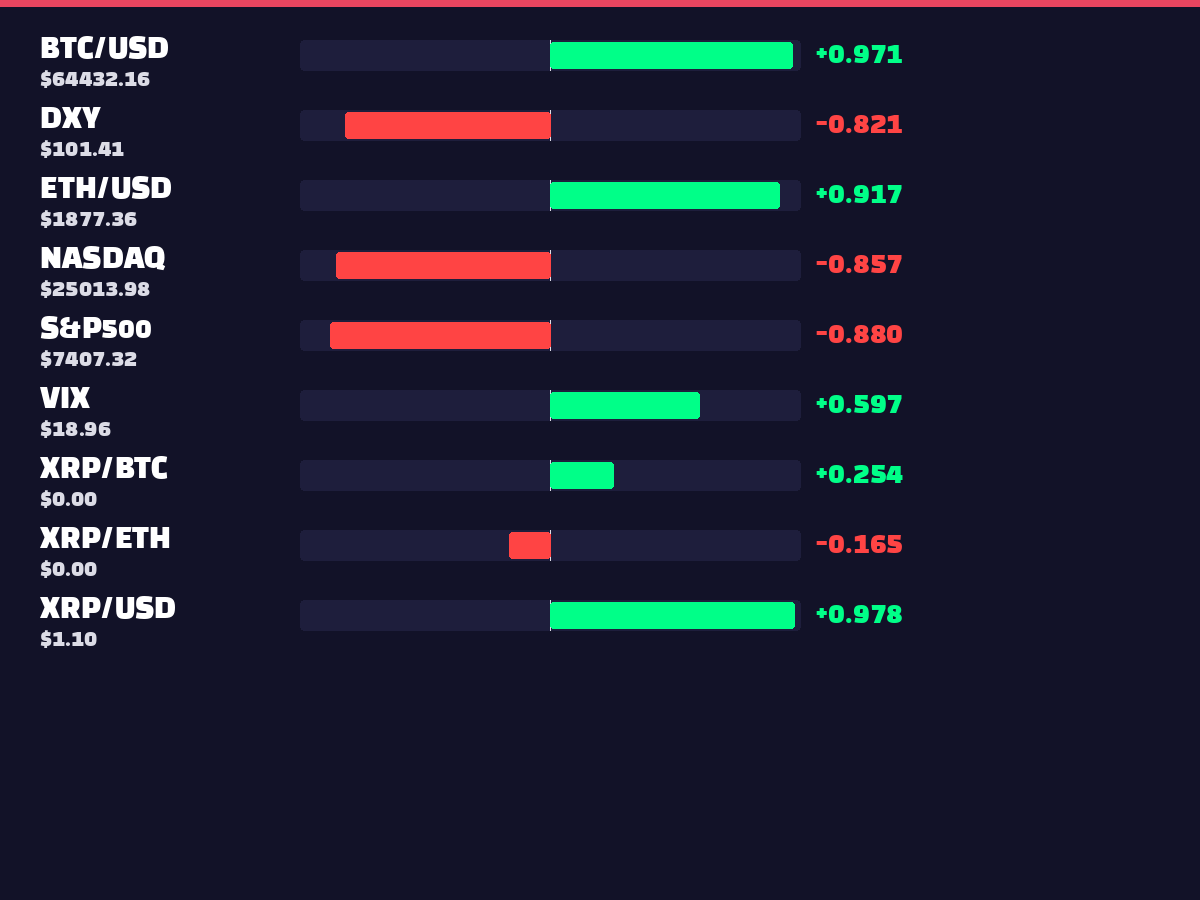
No specific international geopolitical developments were identified in the collected news data. However, correlation analysis shows a strong negative relationship with DXY (-0.8212), suggesting XRP vulnerability to dollar strength. Similarly strong negative correlations with S&P500 (-0.8802) and NASDAQ (-0.8568) indicate potential capital outflows from crypto during traditional market rallies. The positive correlation with VIX (0.5971) suggests XRP may decline alongside increasing market uncertainty and volatility.
4. ⚖️ Regulatory and Legal Environment
No major regulatory developments were confirmed in the current news collection. XRP ETF data reveals net outflows across most funds (XRPT: -$0.9M, XXRP: -$4.4M, XRP: -$5.4M), suggesting diminishing institutional investor interest in XRP exposure through these investment vehicles.
5. 😱 Market Sentiment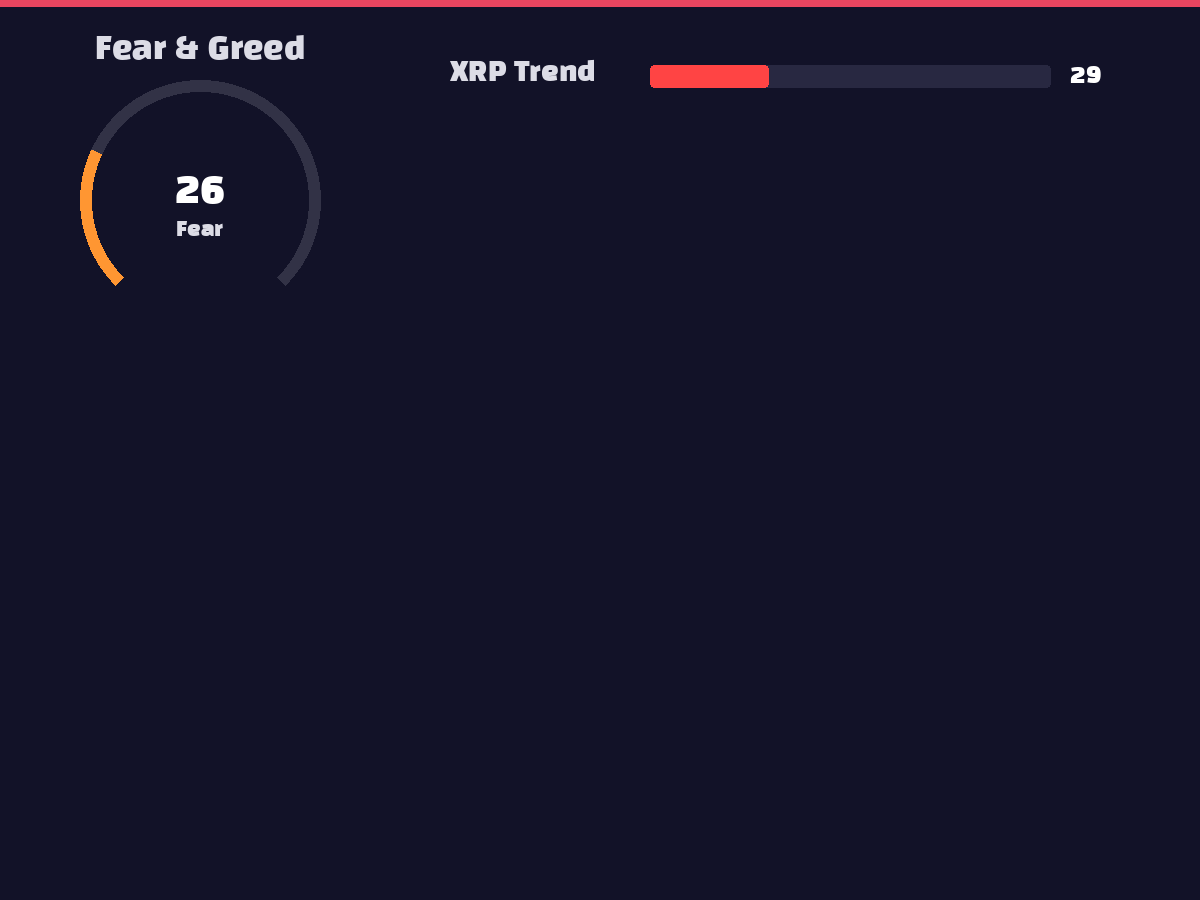
The Fear & Greed Index sits at 26, firmly in "Extreme Fear" territory, reflecting highly conservative investor sentiment. XRP search trends register at 30, indicating relatively low public interest levels. This combination of extreme fear and limited attention could paradoxically signal potential bottom formation, though it may continue to exert short-term downward pressure on prices.
6. 🐋 On-Chain Activity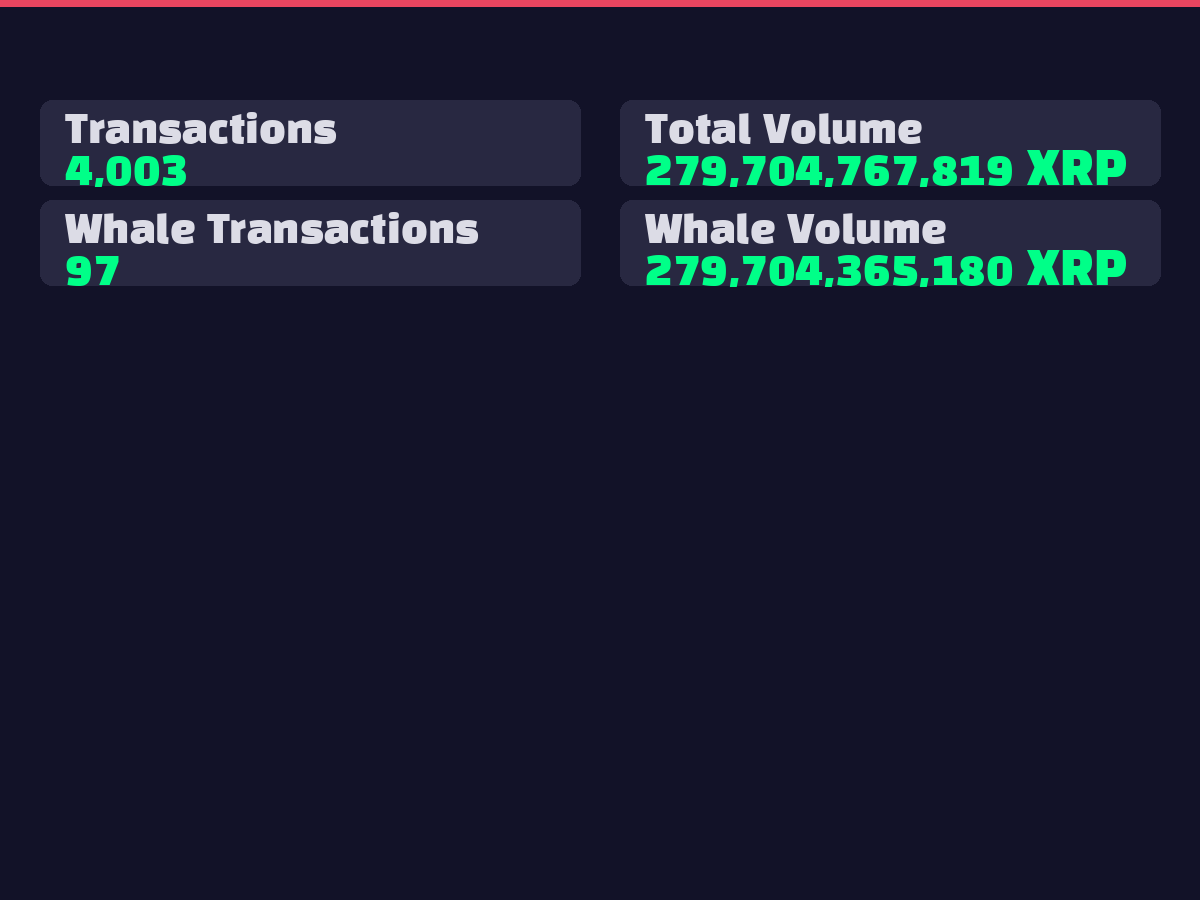
Whale activity shows 97 large transactions totaling 279,704,365,180 XRP. With total network transactions at 4,003, whale activity represents a substantial portion of overall volume. The dominance of large transactions (279,704,365,180 XRP out of 279,704,767,819 total volume) indicates institutional and large investor control over price movements, suggesting retail participation remains limited and strategic positioning by major players drives market dynamics.
7. 📈 Elliott Wave / Wyckoff Analysis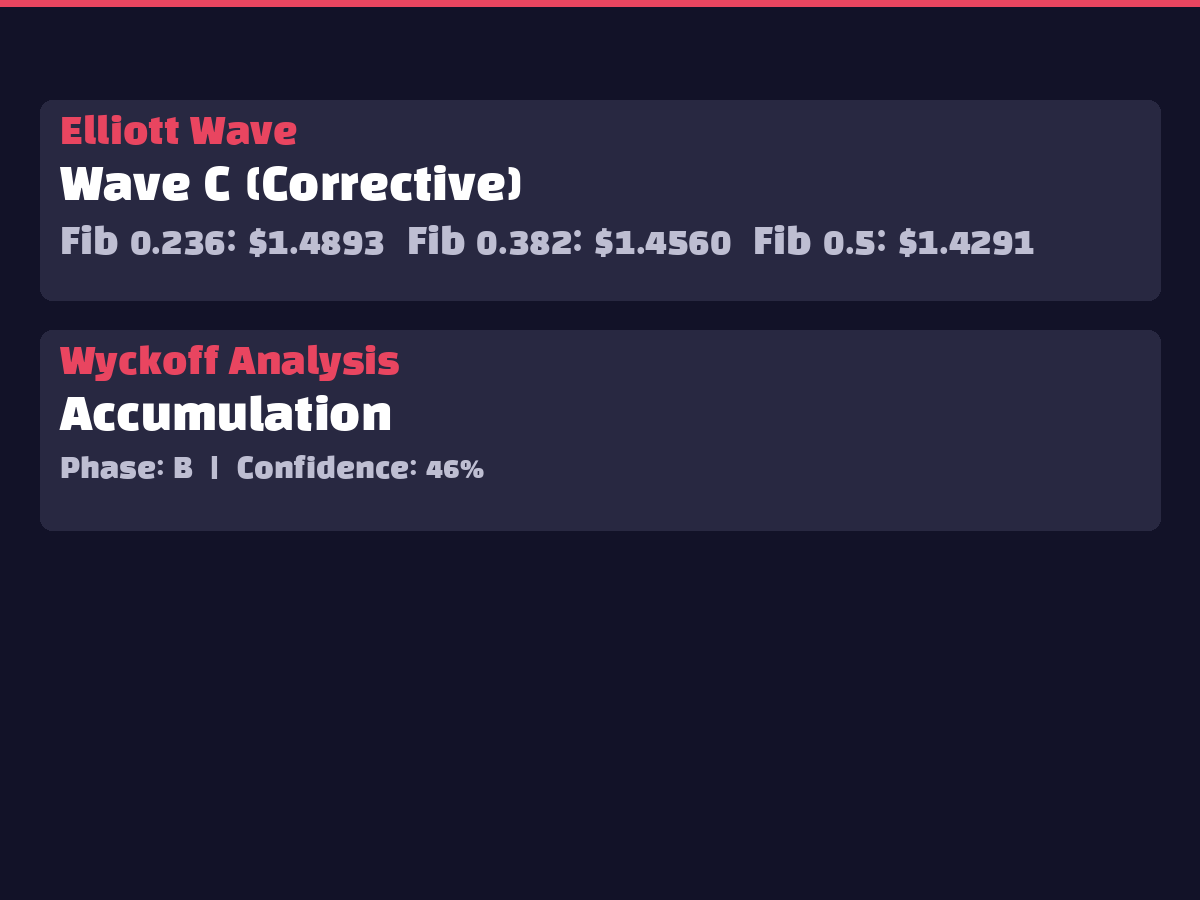
Elliott Wave analysis indicates XRP is currently in Wave C (corrective phase), suggesting continued downward correction potential. Wyckoff analysis places XRP in the Accumulation phase, specifically Stage B, though confidence remains relatively low at 46%. If the accumulation thesis proves correct, smart money may be accumulating at current levels, but the low confidence score necessitates additional confirmation signals.
8. 🤖 AI Prediction Interpretation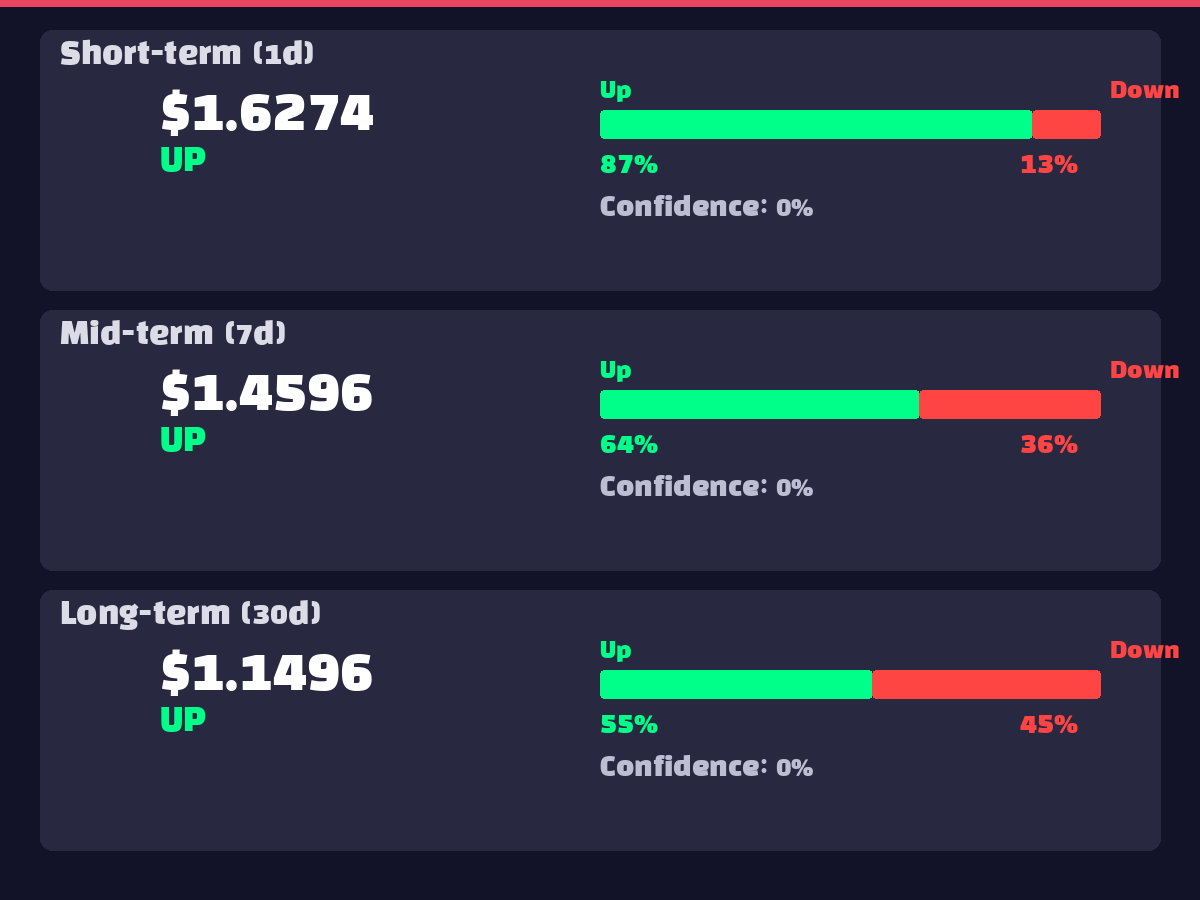
The AI ensemble model forecasts short-term (1-day) $1.6274 (86.5% upward probability), medium-term (7-day) $1.4596 (64.0% upward probability), and long-term (30-day) $1.1496 (54.6% upward probability). The declining magnitude and probability over time suggests strong near-term rebound potential with increasing uncertainty over longer horizons. The aggressive 47.9% short-term upside projection indicates potential for significant volatility expansion.
9. ⚠️ Risk Factors
10. ✅ Comprehensive Opinion
Recommendation: HOLD/WAIT
XRP currently presents a complex scenario with short-term rebound potential coexisting with medium-term uncertainty, warranting cautious observation rather than aggressive positioning.
Key Rationale:
Trading Strategy:
Current conditions favor waiting for clearer directional confirmation before entry, with particular attention to potential support breakdown below $1.05 that could trigger additional downside.