XRP Market Analysis Report
Analysis Time: July 27, 2026, 16:09 (KST) / 2026-07-27 07:09 (UTC)
1. 📌 Market Summary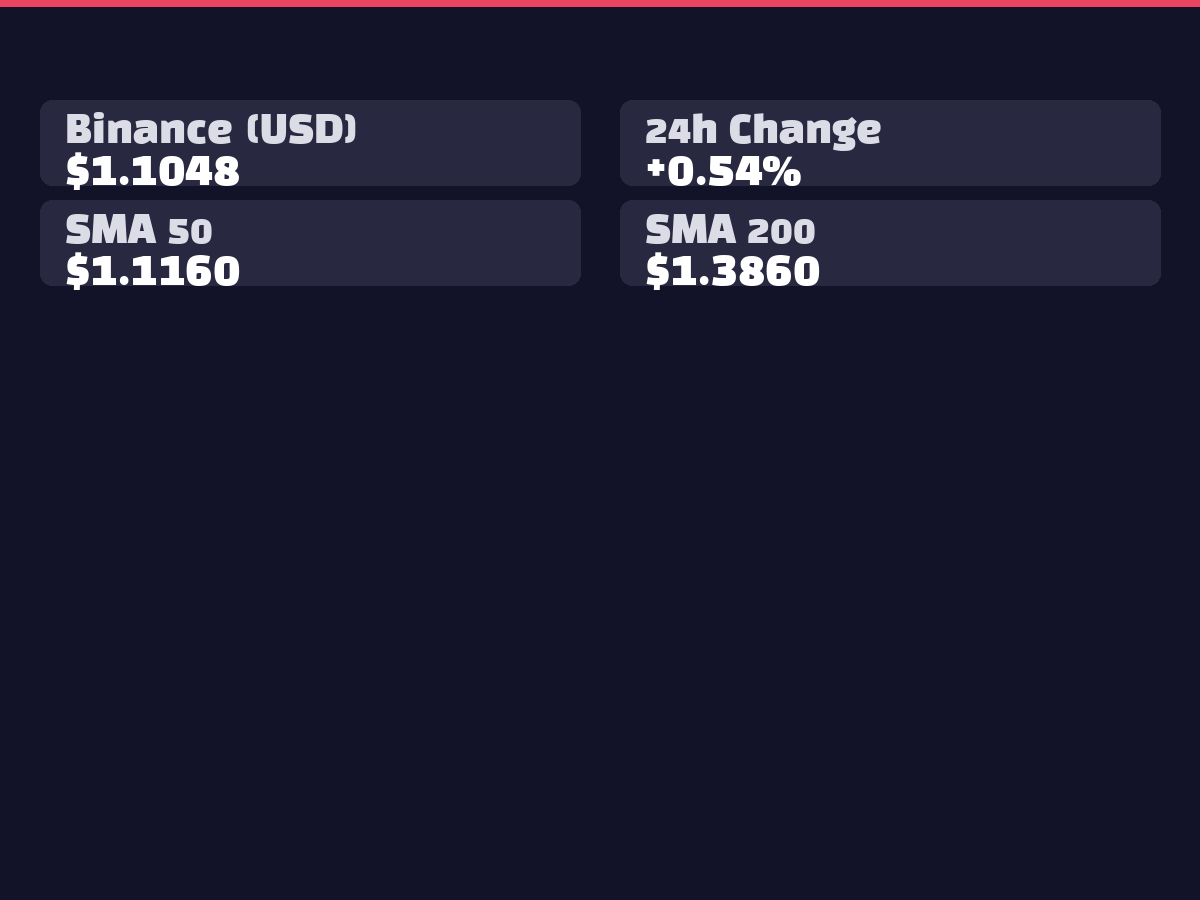
XRP is currently trading at $1.1094, showing a modest gain of +0.80% over the past 24 hours. The Bithumb KRW market reflects similar movement at ₩1,613 with a 0.31% increase, indicating consistent performance across markets. Trading volume stands at 28,363,034 XRP, demonstrating healthy market activity, while whale transactions totaling 1,647 trades suggest sustained institutional interest. AI prediction models are forecasting robust near-term upward momentum, drawing significant attention from market participants.
2. 📊 Technical Analysis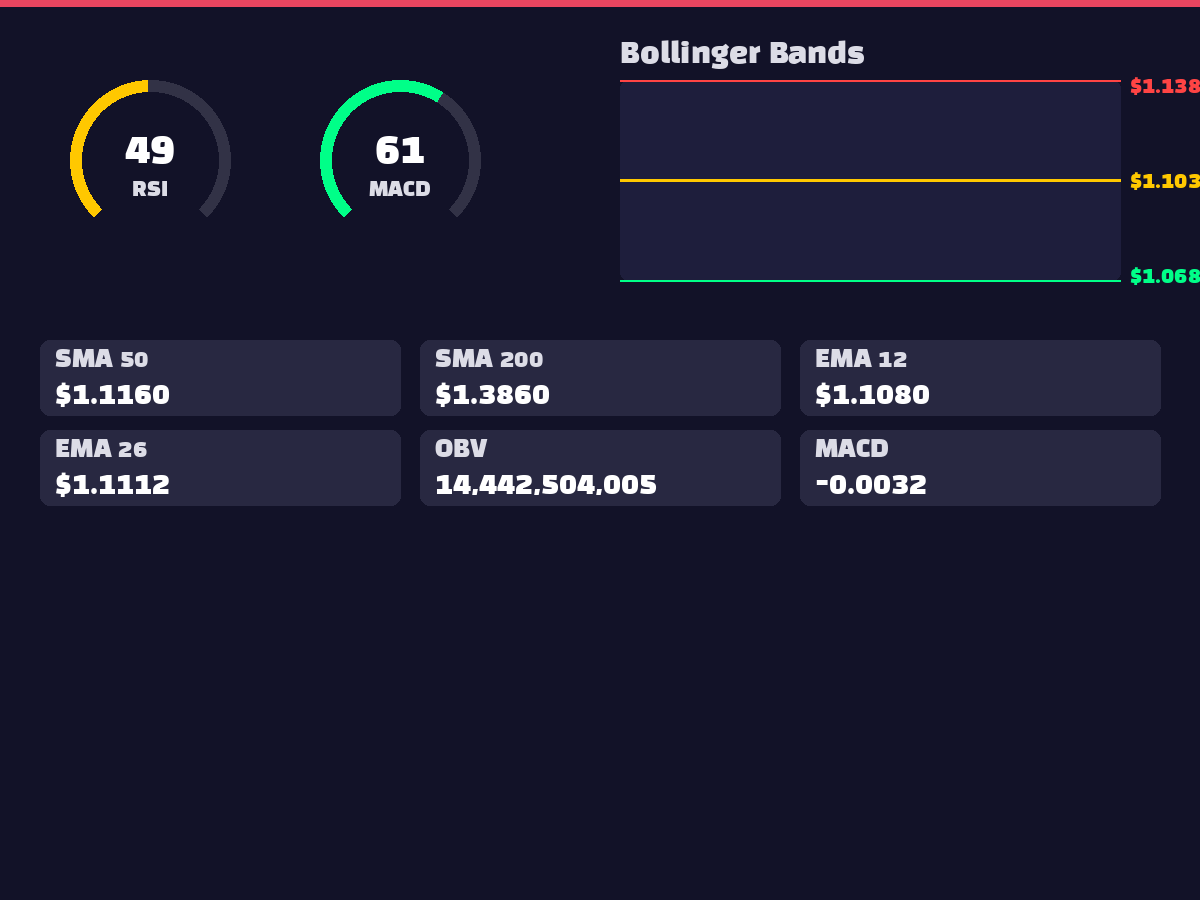
Current technical indicators present a neutral to slightly bullish picture. The RSI(14) at 49.62 remains in healthy territory, avoiding overbought or oversold conditions. The MACD at -0.0032 sits above its signal line of -0.0056, with a positive histogram of 0.0024 suggesting early bullish momentum. Within the Bollinger Bands, the current price trades near the middle band (1.1034), indicating potential for volatility expansion. Moving average analysis reveals the price trading 19.89% below the 200-day MA ($1.3860), though the 5-day MA (1.1102) has crossed above the 20-day MA (1.1034), signaling short-term bullish alignment. The OBV at 14,442,504,005 confirms sustained buying pressure from a volume perspective.
3. 🌍 International Situation and Macroeconomics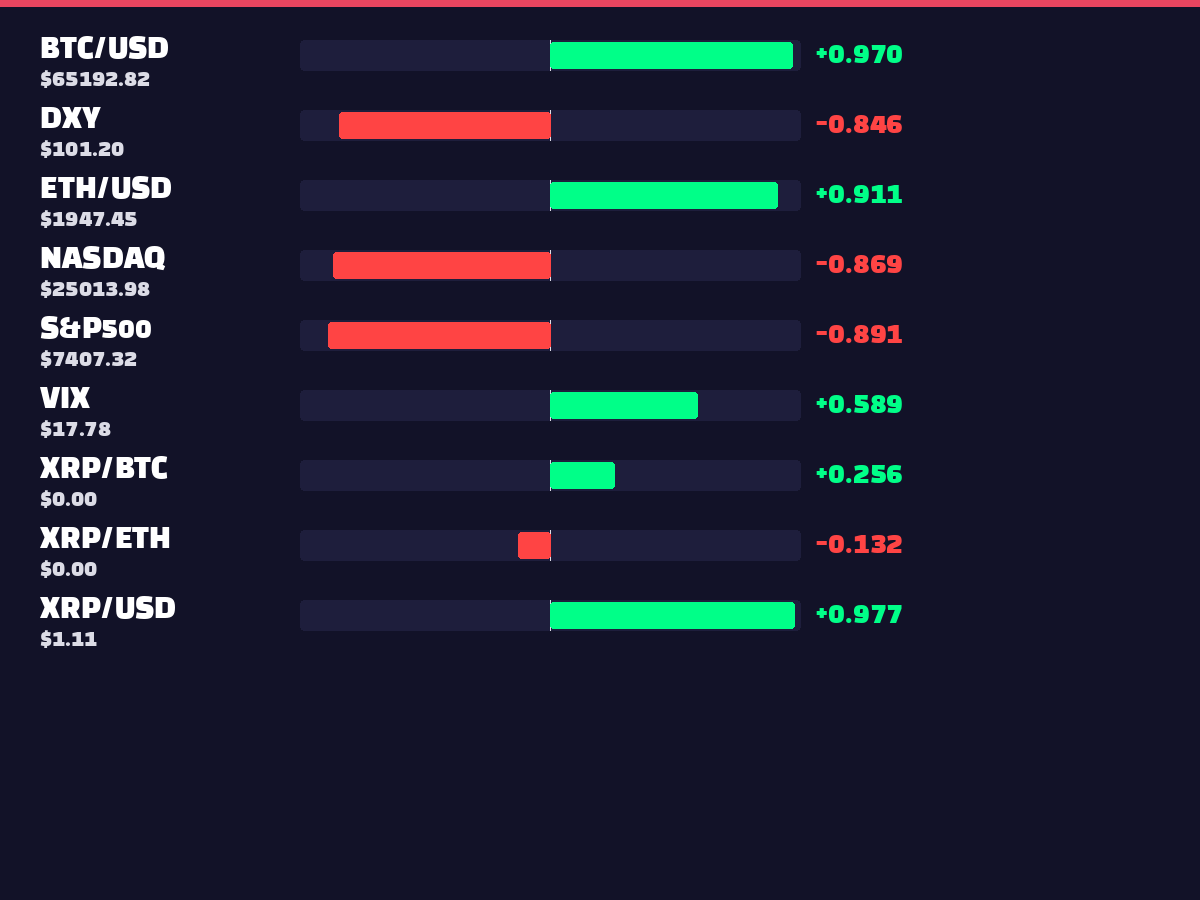
No specific international developments were identified in the current news collection. However, correlation analysis reveals important macroeconomic relationships: XRP shows a strong negative correlation of -0.8457 with the DXY, suggesting significant upside potential during dollar weakness. Notable inverse correlations with S&P500 (-0.8911) and NASDAQ (-0.8693) indicate potential for crypto inflows during traditional market corrections. The 0.6171 correlation with VIX suggests XRP remains susceptible to broader market volatility concerns.
4. ⚖️ Regulatory and Legal Environment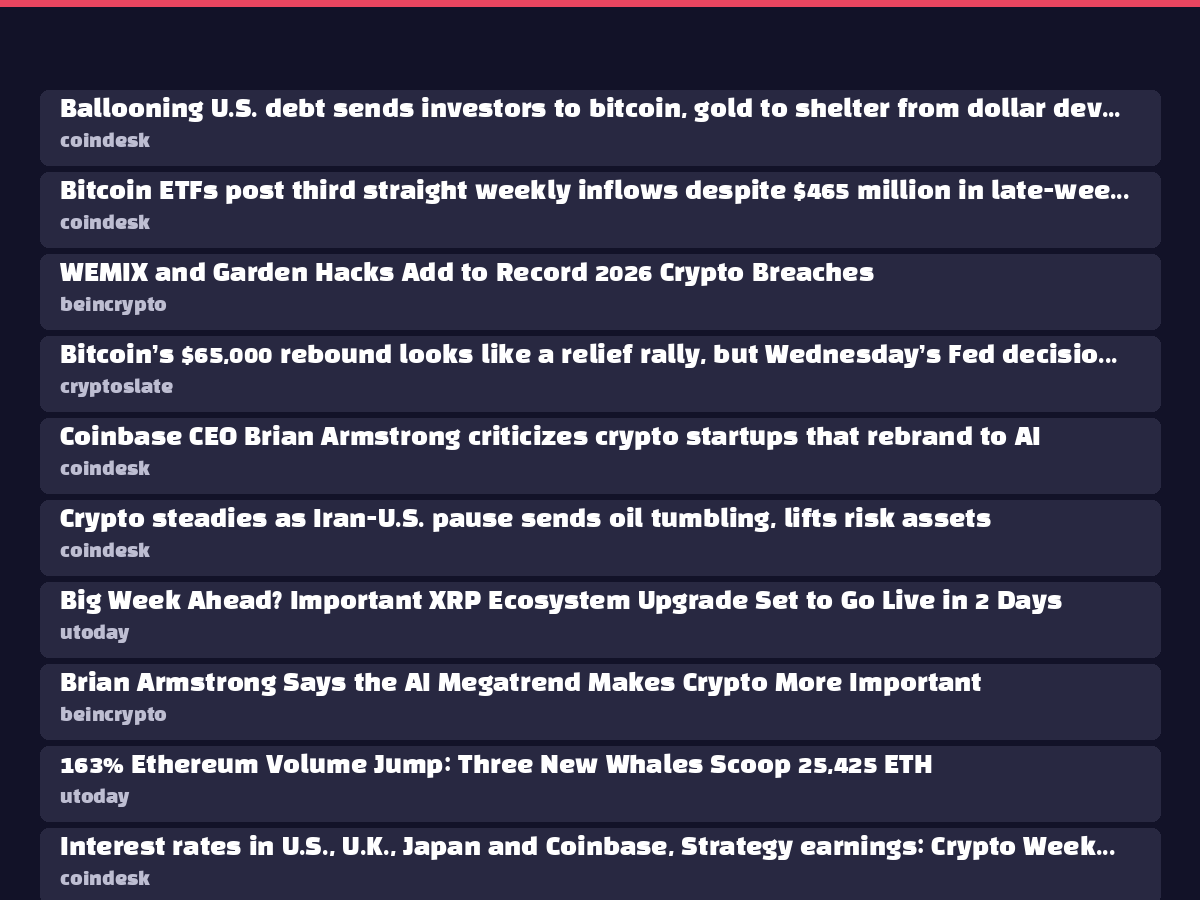
No significant regulatory developments were identified in the current news feed. The XRP ETF landscape shows predominantly negative flows across major funds, with estimated net outflows totaling approximately -$12.5M, suggesting institutional caution in the near term. This outflow pattern indicates a wait-and-see approach from institutional investors.
5. 😱 Market Sentiment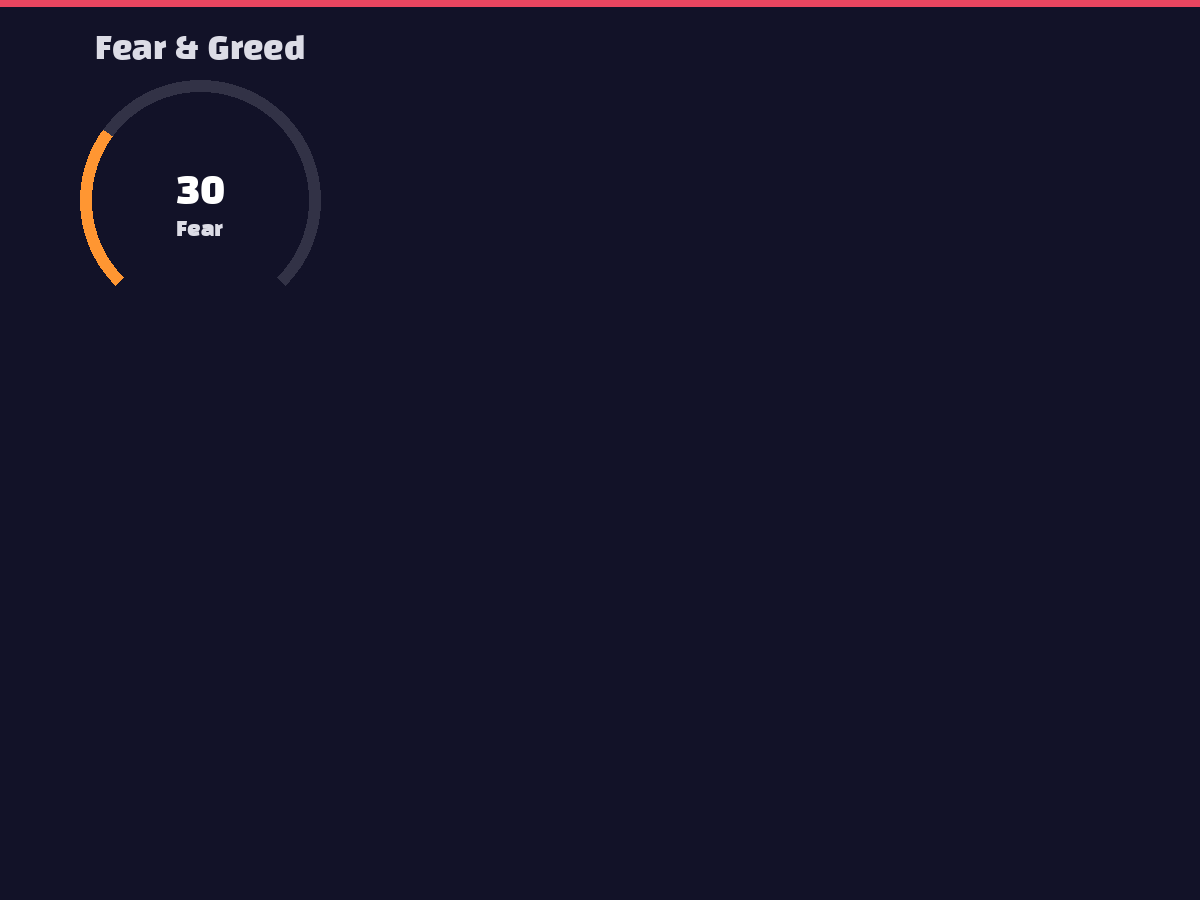
The Fear & Greed Index stands at 30, firmly in "Fear" territory, reflecting conservative investor sentiment. This contrarian indicator potentially signals oversold conditions ripe for reversal. The widespread ETF outflows reinforce near-term bearish sentiment but simultaneously create conditions for momentum-driven buying on any positive catalyst. The high 0.9702 correlation with Bitcoin indicates XRP continues to trade within the broader crypto ecosystem's influence.
6. 🐋 On-Chain Activity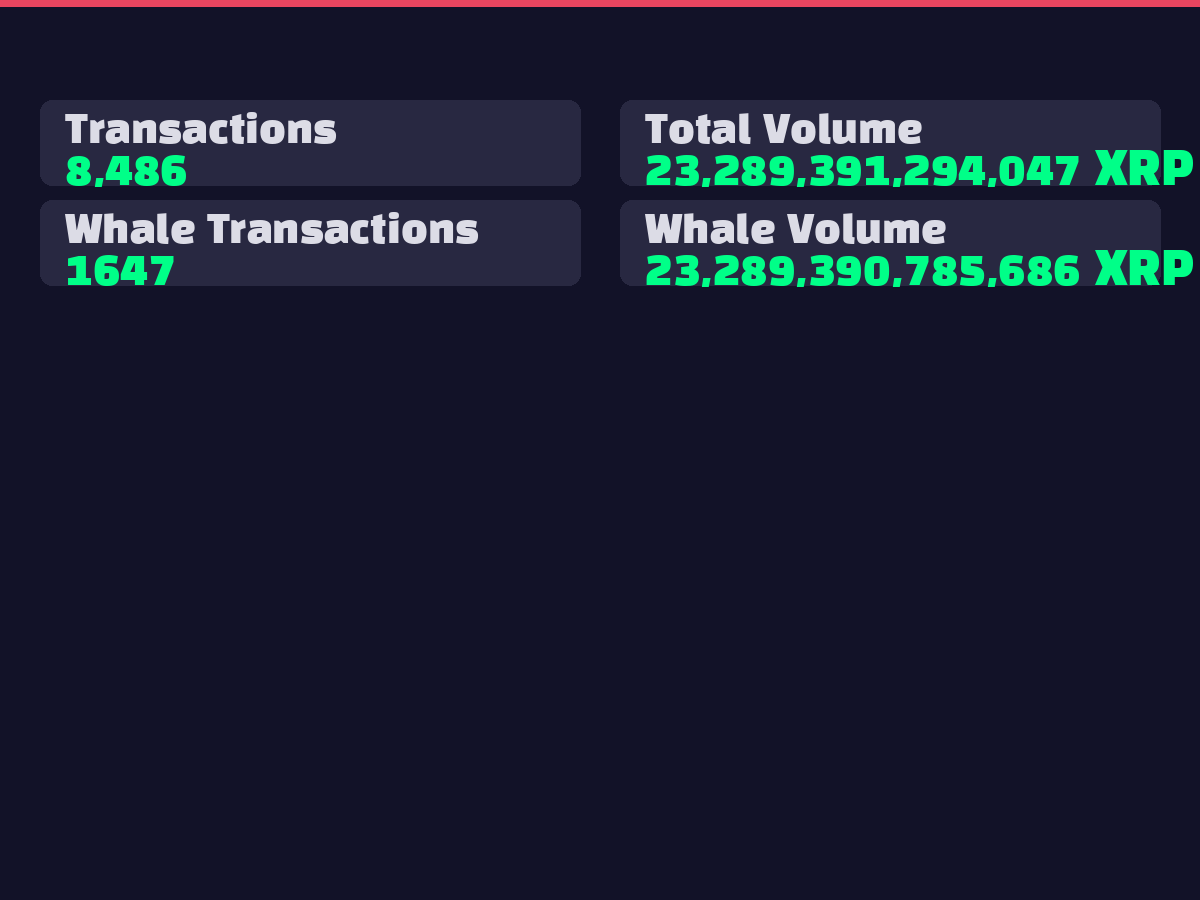
Whale activity shows significant engagement with 1,647 transactions involving 23,289,390,785,686 XRP, representing substantial institutional movement. Against total transaction count of 8,486, whale activity dominates market dynamics. The average whale transaction size of approximately 14.14 million XRP indicates major position adjustments are underway, potentially setting the stage for increased price volatility.
7. 📈 Elliott Wave / Wyckoff Analysis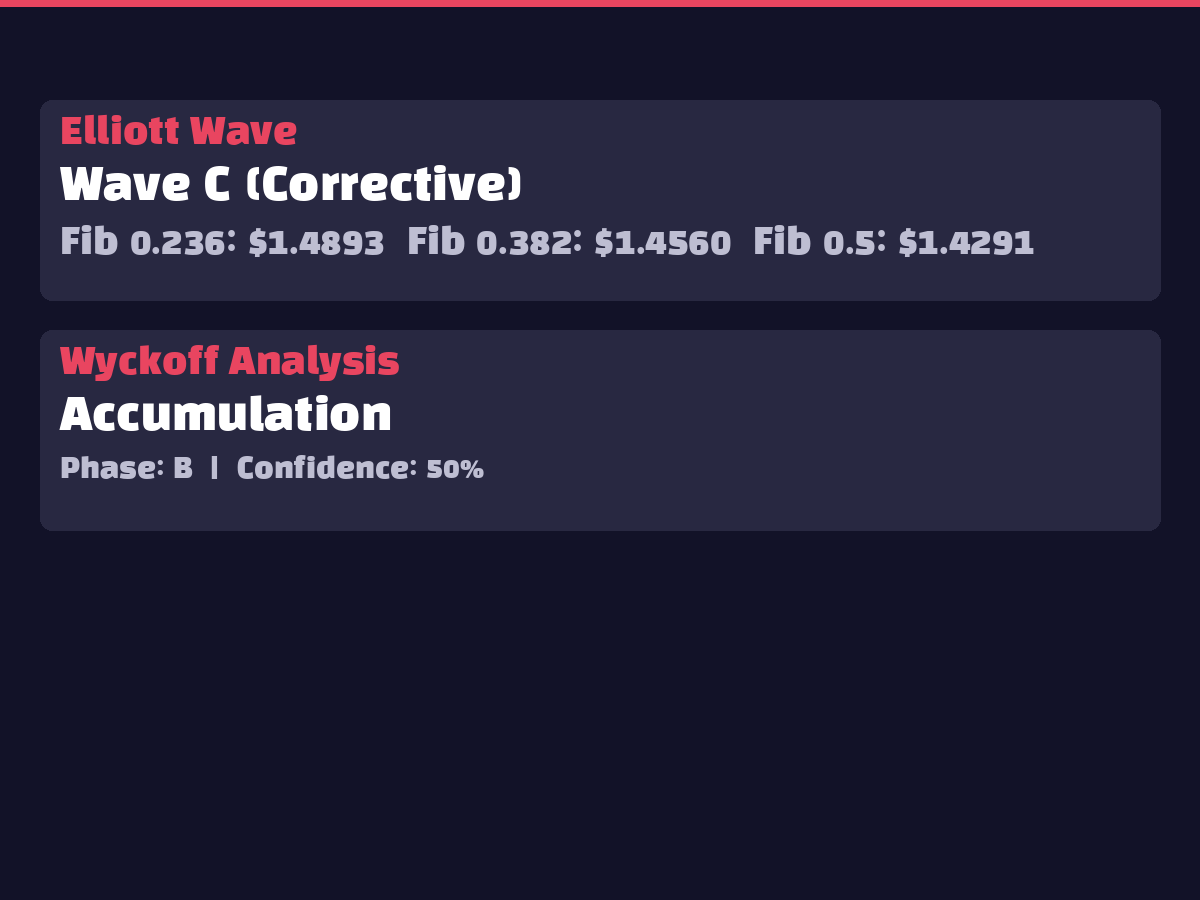
XRP currently appears to be in Elliott Wave C (corrective) phase, representing a natural correction following a major impulse wave. This suggests potential completion of the corrective cycle and preparation for a new upward sequence. Wyckoff analysis places XRP in the Accumulation phase, specifically stage B, with 50% confidence. This indicates smart money accumulation at lower levels, positioning for the eventual markup phase transition.
8. 🤖 AI Prediction Analysis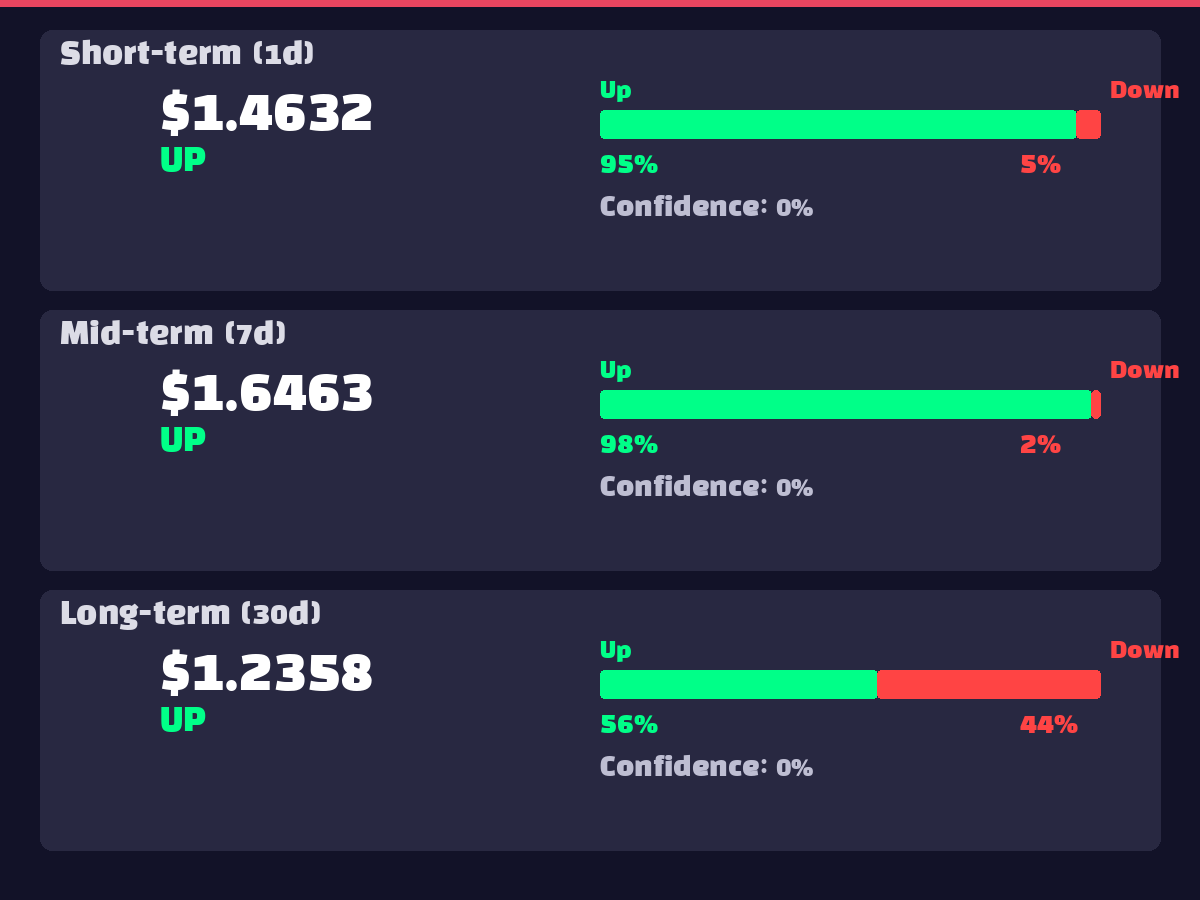
The AI ensemble models present compelling short-term bullish signals. The 1-day prediction of $1.4632 (95.2% upward probability) represents a substantial 31.9% gain from current levels, indicating strong algorithmic confidence in near-term appreciation. The 7-day forecast extends to $1.6463 (98.2% upward probability), suggesting sustained momentum. However, the 30-day prediction moderates to $1.2358 (55.6% upward probability), implying potential correction following initial gains. This pattern suggests optimal timing for momentum-based entries with disciplined profit-taking strategies.
9. ⚠️ Risk Factors
10. ✅ Overall Assessment
Recommendation: Short-term BUY (Conditional Aggressive Buy)
Key supporting factors:
Specific Trading Strategy:
Strategy emphasizes capturing short-term momentum while maintaining disciplined risk management for subsequent longer-term consolidation phases.