XRP Market Analysis Report
Analysis Time: July 28, 2026 16:09 (KST) / 2026-07-28 07:09 (UTC)
1. 📌 Market Summary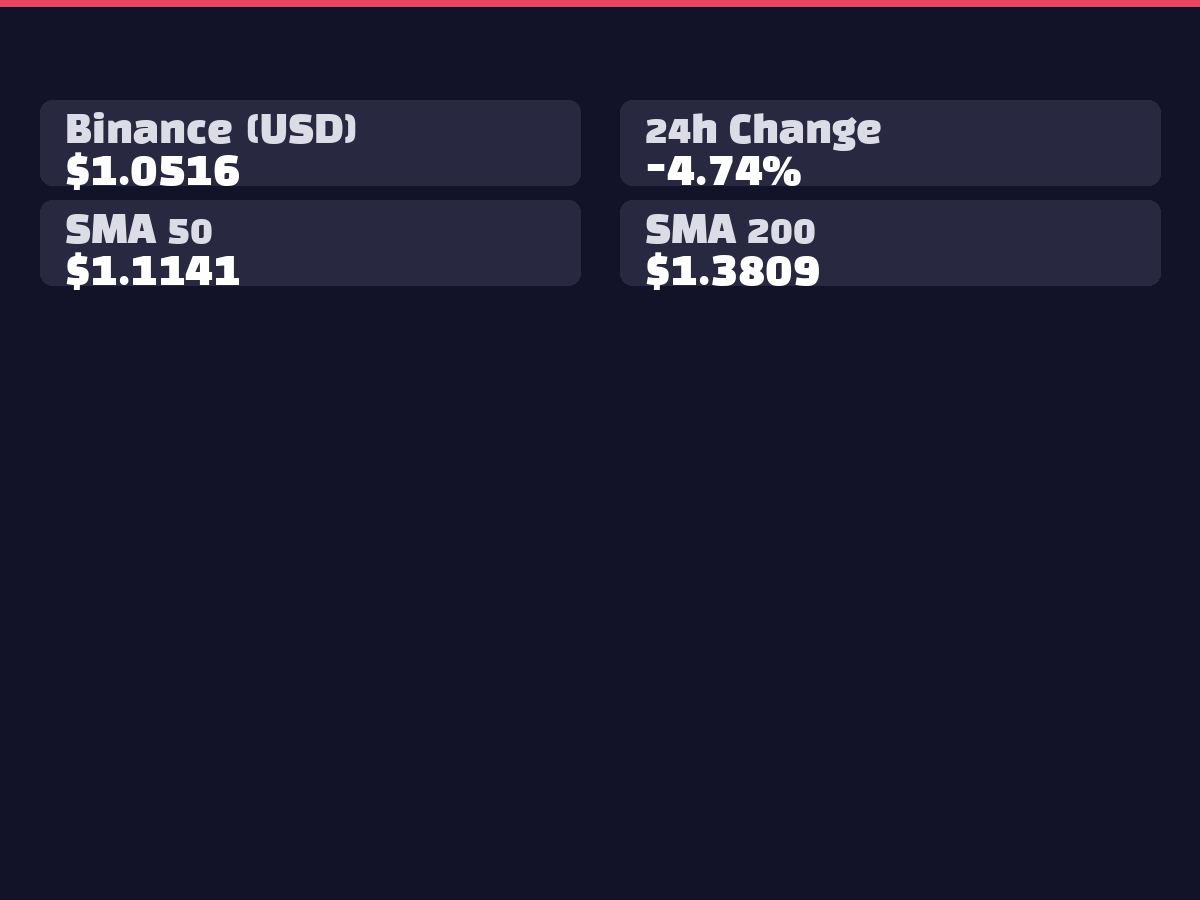
XRP is currently trading at $1.0601 on Binance, showing a -4.43% decline over the past 24 hours. On Bithumb, it trades at ₩1,542 with a similar decline of -4.40%. The 24-hour trading volume of 66,519,688 XRP demonstrates substantial liquidity, while the current price is finding support near the lower Bollinger Band at $1.0623. AI prediction models are forecasting a strong upward reversal in the short term, suggesting that the current correction may present a buying opportunity.
2. 📊 Technical Analysis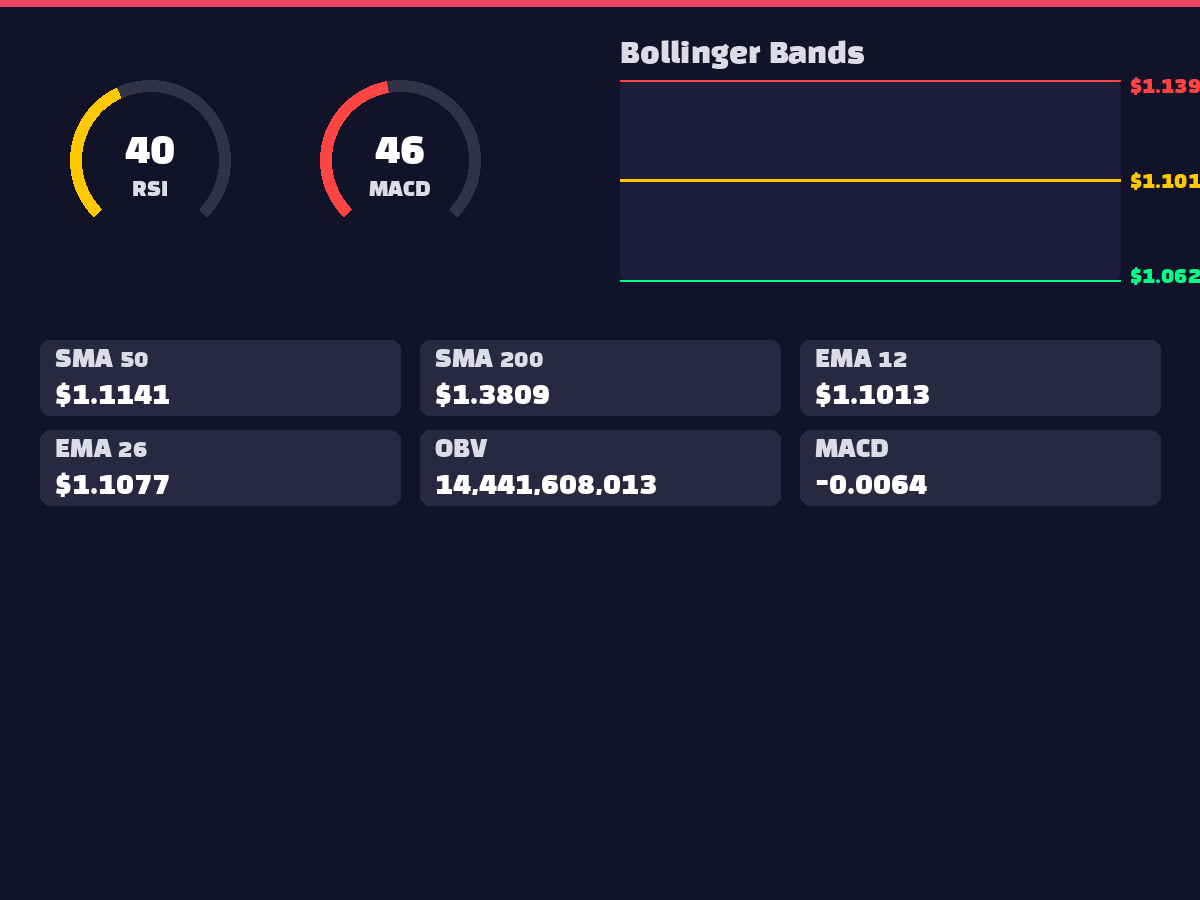
Current technical indicators suggest an oversold condition with potential for rebound. The RSI(14) at 40.76 sits in the lower neutral zone, indicating limited further downside potential. MACD shows weakness at -0.0064, but the relatively small histogram (-0.0007) signals momentum deceleration. The current price of $1.0601 is finding support near the lower Bollinger Band at $1.0623, suggesting high probability of technical bottom formation. Key moving averages (SMA 5-day: 1.0945, 20-day: 1.1010) are positioned above current price, acting as resistance levels, while the significant -22.93% discount from the 200-day moving average ($1.3809) indicates substantial undervaluation.
3. 🌍 International Situation and Macroeconomics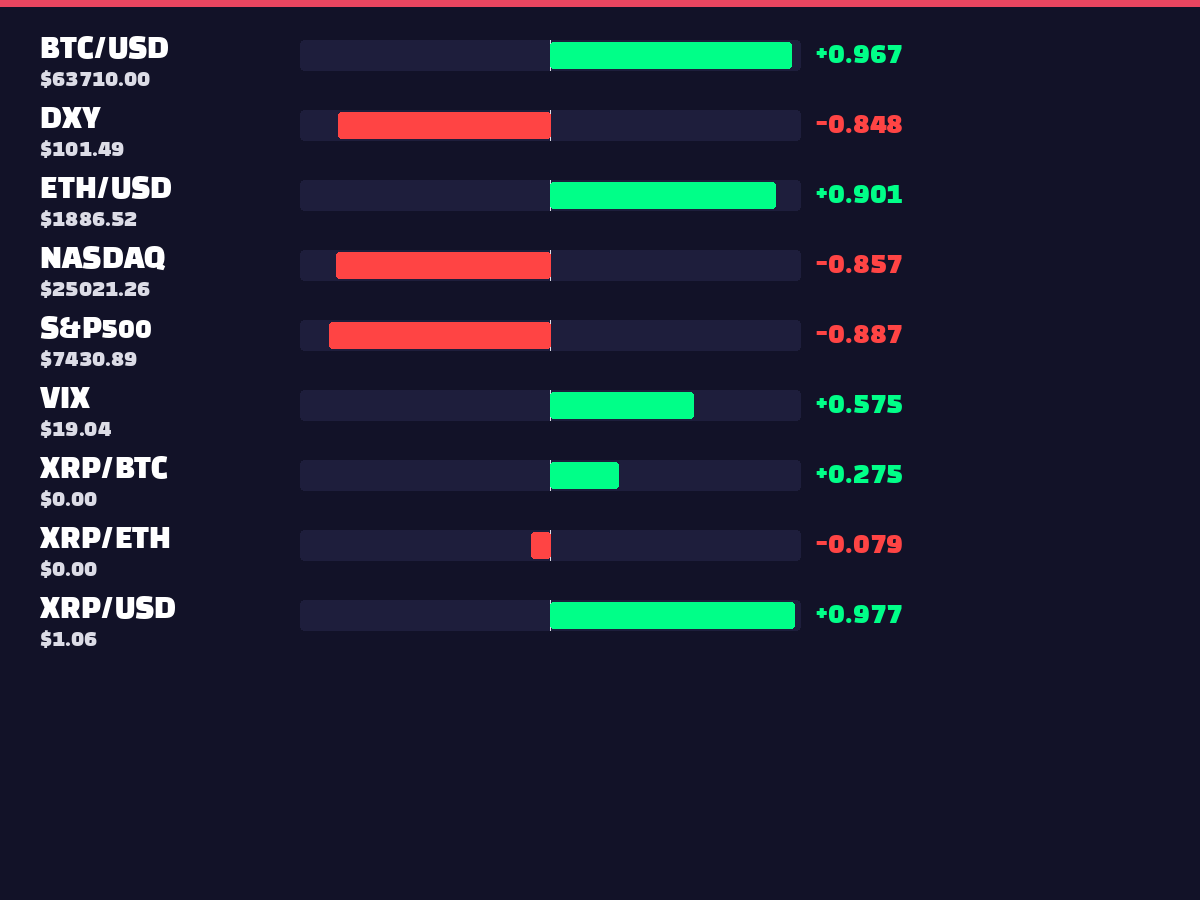
While no specific international developments were confirmed in the collected news, correlation asset data reveals important market dynamics. The Dollar Index (DXY) at 101.4860 shows a strong negative correlation of -0.8478 with XRP, indicating that dollar strength is creating downward pressure on XRP. The S&P500 (7430.8901) and NASDAQ (25021.2578) show negative correlations of -0.8872 and -0.8578 respectively with XRP, suggesting that traditional market strength is leading to capital outflow from cryptocurrencies. The VIX at 17.78 remains at low levels, indicating limited market anxiety factors.
4. ⚖️ Regulatory and Legal Environment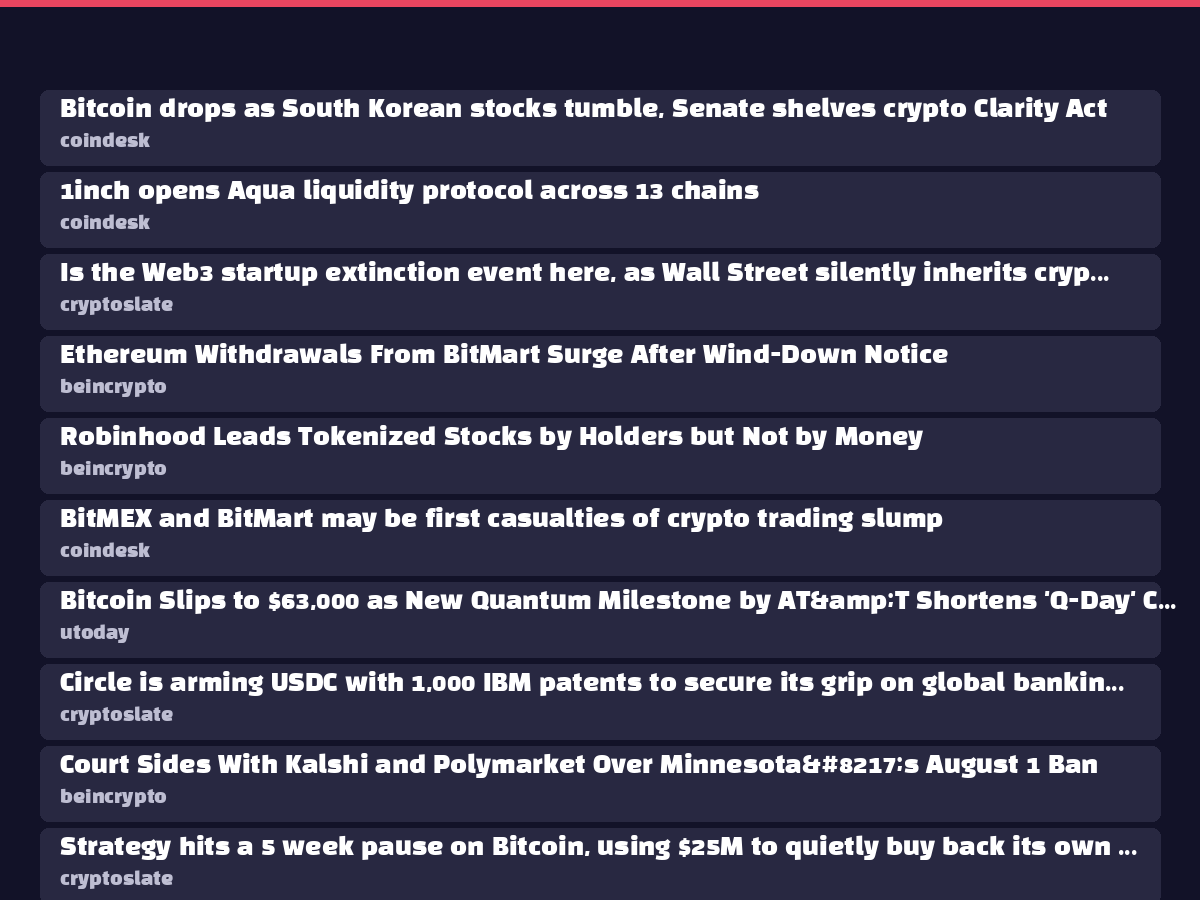
No major regulatory changes were identified in the currently collected news. XRP ETF trading activity shows overall net outflows, reflecting institutional investors' short-term cautious stance. The main XRP ETF recorded -$8.8M in net outflows, while XRPT (-$2.8M), XXRP (-$2.6M), and XRPZ (-$2.3M) all showed net outflows. This appears to be a temporary phenomenon due to market correction rather than regulatory uncertainties.
5. 😱 Market Sentiment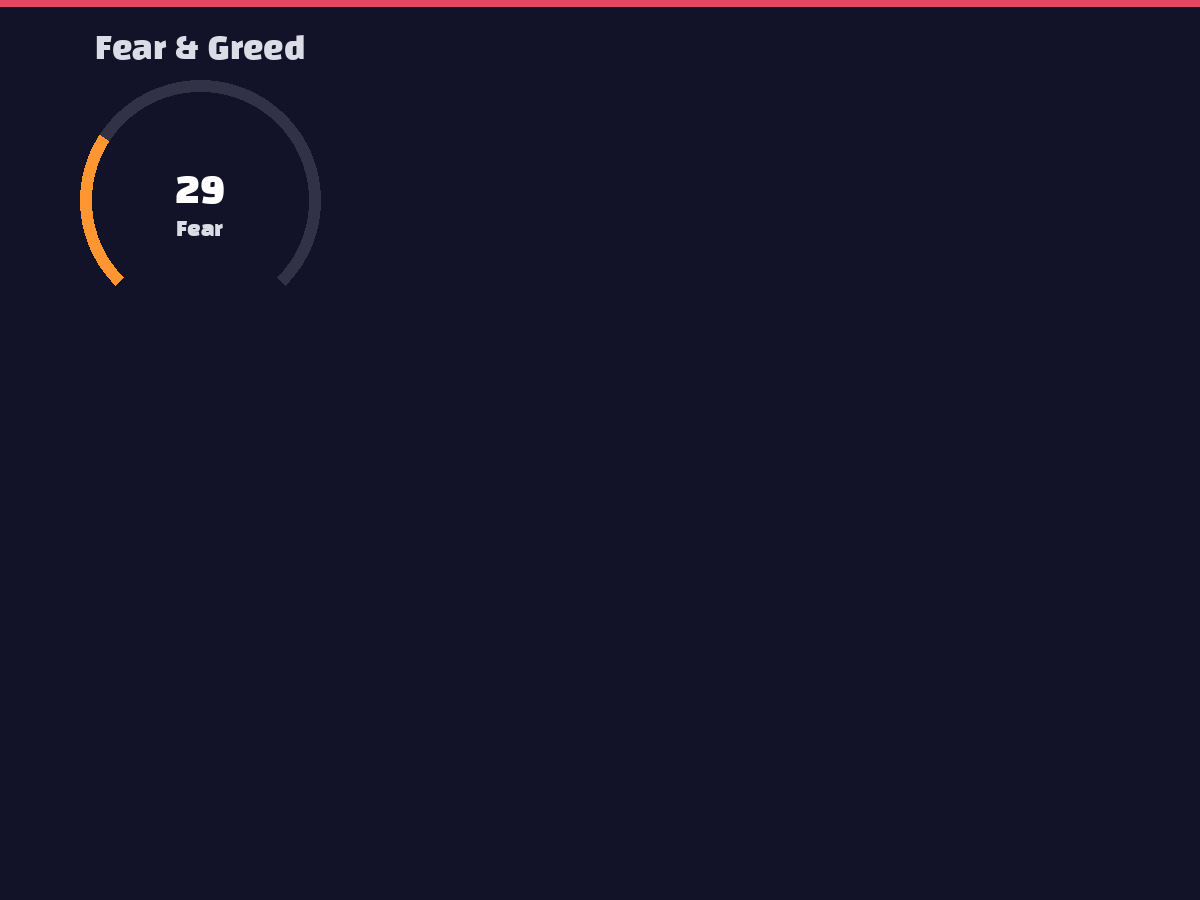
The Fear and Greed Index has entered extreme fear territory at 29. Paradoxically, this can be interpreted as a market bottom signal, with excessive pessimism dominating the current situation. The strong correlation with Bitcoin (0.9672) remains intact, showing that overall cryptocurrency market sentiment directly impacts XRP. The current extreme fear psychology often serves as a contrarian indicator providing buying opportunities, and excessive pessimism among market participants is likely to become the foundation for a rebound.
6. 🐋 On-Chain Activity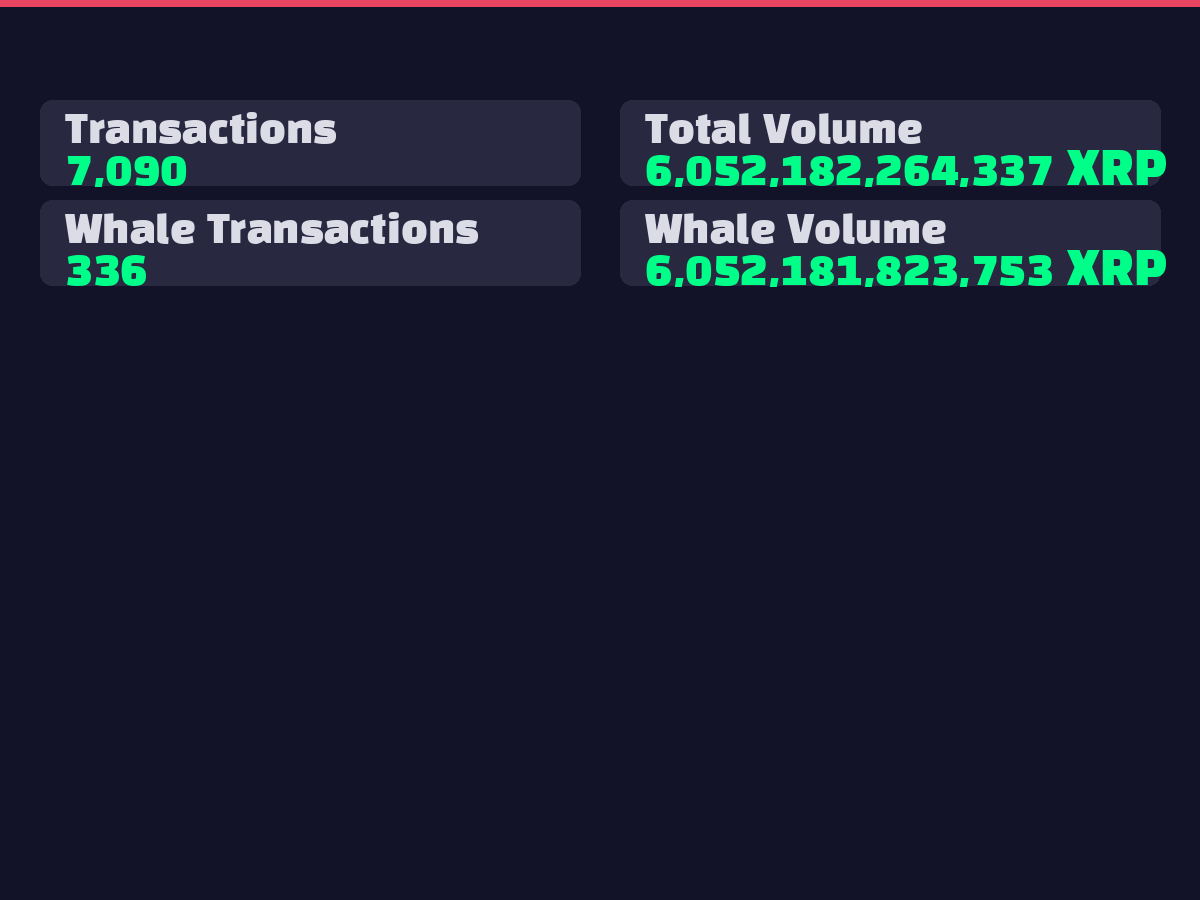
On-chain data reveals significant large transaction activity. Among 7,090 total transactions, whale transactions account for 336 transactions (approximately 4.74%), while by volume, whale transactions represent 6,052,181,823,753 XRP, nearly 100% of total transaction volume. This suggests limited activity from retail investors while large investors are actively adjusting positions. Active whale trading can be interpreted as either seizing buying opportunities at current price levels or large-scale rebalancing.
7. 📈 Elliott Wave / Wyckoff Analysis
Current Elliott Wave analysis indicates position in Wave C correction phase. This represents the final stage of downward correction, suggesting potential approach to the starting point of a new upward cycle. Wyckoff analysis classifies this as Phase B of the Accumulation stage with 46% confidence. The accumulation stage represents a period where smart money collects volume at low prices, suggesting current decline may be preparation for long-term upward movement. Phase B is the early accumulation stage, with transition to more aggressive buying phases expected.
8. 🤖 AI Prediction Results Interpretation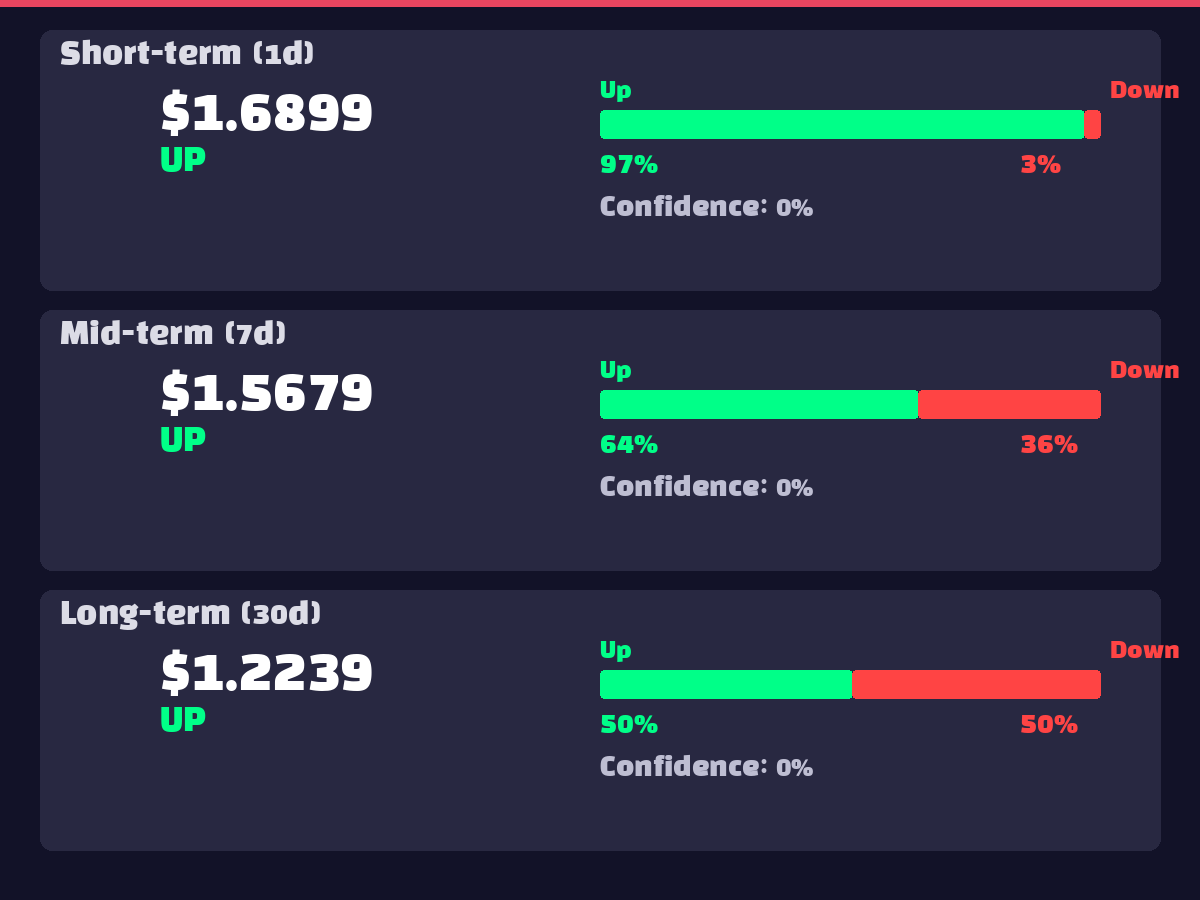
AI ensemble model predictions show very interesting patterns. Short-term (1-day) prediction of $1.6899 expects 59.4% upside from current levels with 97% probability, indicating strong reversal signals. Medium-term (7-day) prediction of $1.5679 still expects 47.9% upside but with more conservative 63.7% probability. Long-term (30-day) prediction of $1.2239 expects modest 15.5% upside with 50.5% probability showing increased uncertainty. This pattern suggests potential for sharp short-term rebound followed by gradual correction, highlighting the importance of current entry timing.
9. ⚠️ Risk Factors
10. ✅ Comprehensive Opinion
Recommendation: BUY (Dollar-Cost Averaging Strategy)
XRP currently presents a clear buying opportunity. First, AI models show an overwhelming 97% short-term upside probability, indicating high technical rebound potential. Second, current price is finding support near the lower Bollinger Band and has entered value buying territory with a -22.93% discount from the 200-day moving average. Third, the extreme fear reading of 29 paradoxically serves as a bottom signal, while the Wyckoff accumulation phase indicates smart money collection period. Fourth, active whale trading activity suggests opportunity recognition at current levels.
Specific Investment Strategy: